By Leslie N. Masonson, MBA
General Electric Company (GE: NYSE), the historic American multinational conglomerate, based in Boston and incorporated in 1892, once stood proudly as the sole survivor among the original thirty companies listed on the well-known Dow Jones Industrial Average. However, its reign came to an end on June 19, 2018, when it was replaced by Walgreens Boots. These were tumultuous times for GE, a former blue-chip titan that found itself entangled in a web of ill-fated business decisions, resulting in a distressing combination of dwindling profits and lackluster stock performance. The evidence of this downward spiral was stark: GE’s stock price plummeted by a staggering 42% from December 22, 2016, to May 26, 2023, while the broader S&P 500 index soared by 66%.
Yet, in a remarkable reversal of fortune, during the more recent period spanning August 25, 2020, to May 26, 2023, GE’s stock price experienced a resounding resurgence, surging by an impressive 152% compared to the benchmark’s modest 22% gain. Moreover, from December 1, 2022, to May 26, GE achieved a remarkable leap of 54.7%, in stark contrast to the meager 3.2% crawl of the overall market. Such substantial outperformance is a testament to the cyclical nature of stocks, which often alternate between periods of dominance and subservience. And now, it appears that GE may be on the cusp of another upswing in its trajectory. The question arises: Is this the opportune moment to hop on board for the next ascent? Let’s delve into the facts and examine VectorVest metrics to shed light on the matter.
GE, although still a sizable multinational conglomerate, remains merely one-tenth the size of the esteemed Berkshire Hathaway, which I reviewed in my previous article a week ago. For two decades, GE was skillfully headed by Jack Welch until his retirement in 2001, during which time he bolstered its market value through a flurry of strategic acquisitions. Under Welch’s stewardship, GE’s stock, at certain points, commanded the largest market capitalization in the United States.
Unfortunately, the tides turned under the leadership of Jeffrey Immelt, and the 2008 financial crisis dealt a severe blow, causing the stock to plummet by 42% and nearly pushing GE to the brink of collapse during the Great Recession from December 2007 to June 2009. Despite these hardships, GE remains a force to be reckoned with, boasting a sprawling global workforce of approximately 175,000 employees stationed across 175 countries.
At present, the company has staged a remarkable recovery from its troublesome periods. GE comprises two distinct components: GE Aerospace and GE Verona. Together, their adjusted earnings per share (EPS) for 2022 amounted to $0.77, while estimates for 2023 range from $1.60 to $1.70, representing a potential increase of over 100%. The former division stands as a global leader in engineering, commercial, and defense sectors, while Verona specializes in renewable energy transformation services.
Unsurprisingly, GE remains a favored holding among prominent money managers, with institutional investors controlling a substantial 72.8% of the shares outstanding, while insiders hold a minuscule 0.20%. Furthermore, 1,960 institutions have chosen to include GE in their portfolios. For instance, Vanguard Group possesses a staggering 87.7 million shares, constituting 10% of all outstanding shares, followed predictably by Black Rock Inc. and FMR, LLC, each holding 6%. The top position is occupied by Capital Research Global Investors, boasting an impressive 104 million shares or 9.6%. Surprisingly, General Electric Company offers a meager dividend yield of 0.31%, a figure that pales in comparison to the average of 1.18% observed among the VectorVest stocks tracked.
Looking beyond this lackluster dividend, GE’s forecasted earnings per share (EPS) stands at an impressive $4.38. Additionally, its price-to-earnings (P/E) ratio of 23.5 presents a favorable comparison to the broader VectorVest universe, where stocks command a higher average ratio of 48.6. The stock’s average daily trading volume of 5.9 million shares indicates ample liquidity and a narrow bid-to-ask spread.
However, it is crucial to note that GE bears a beta of 1.21, signifying a 21% higher volatility compared to the S&P 500. This statistic should give conservative investors pause, as it suggests a potentially turbulent journey lies ahead, albeit with hopes of an upward trajectory. As a member of the VectorVest Diversified Companies category, GE claims the 13th spot among 100 stocks, while the sector itself ranks 20th among 41 sectors tracked. Consequently, GE finds itself in the upper echelons of both categories, residing within the top 13% and top 43%, respectively.
With Five “Good” VectorVest Scores, GE Belongs on Your Watchlist
VectorVest helps you make careful and unemotional investing and trading decisions. Just reading the financial media and buying the stocks that everyone is buying will not lead to success in the long run. Using VectorVest’s time-tested and back-tested approach will provide you with a hard-number analysis of what a stock is worth and whether it should be bought or sold. So, pay attention to the ratings below before making any investment decision.
Make sure to identify and review GE’s key metrics:
- Good Upside Potential: The Relative Value (RV) rating focuses on a stock’s long-term, three-year price appreciation potential. The current RV rating for GE is 1.15 which is above average on a scale of 0.00-2.00. VectorVest currently pegs the stock’s value at $84.72 while the current price of $102.74 is in a faraway neighborhood.
- Fair Safety: The Relative Safety (RS) rating is based on the company’s business longevity, financial predictability/consistency, debt-to-equity ratio, and additional risk parameters, including price volatility. Its RS rating of 0.99 is about average, indicating that it is suitable for conservative investors.
- Good Timing: The Relative Timing (RT) rating focuses on the price trend over the short, medium, and long term. The components include price direction, dynamics, and price magnitude of price changes over daily, weekly, quarterly, and yearly comparisons. GE has a moderately above average RT rating of 1.18 compared to the average 0.99 RT of all the stocks in the database which means that the stock has been performing better than average over multiple timeframes.
- Very Good Comfort Index: This index measures the consistency of a stock’s long-term resistance to severe and lengthy corrections. This index compares the individual stock to the fluctuation of the VectorVest Composite price that is measured on a scale of 0 to 2.00. At a level of 1.32, GE’s rating is well above average. Therefore, this stock should be considered by only more conservative investors with a below-average appetite for market volatility.
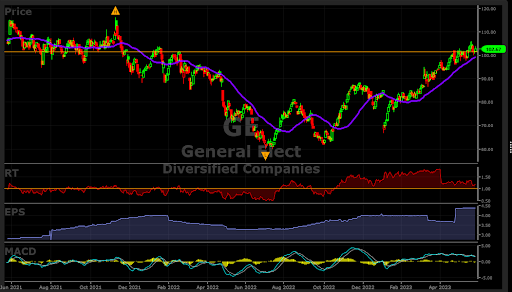
- Very Good Growth Rate (GRT): GE’s 20% forecasted growth rate is measured over a forecasted three-year period. This fundamental factor is calculated in the VectorVest software, so you don’t have to do the work. The chart below highlights the choppy, but increased last quarterly earnings. Moreover, this is coupled with good sales growth of 14%.
- Good VST Score: The VST Master Indicator ranks 9,137 stocks from high to low and brings stocks with the highest VST scores to the top of the list. GE’s slightly above-average score is 1.11 Using VST enables users to identify stocks that are performing better than average, as well as those performing slightly worse than average. Currently, GE falls in the former category.
GE possesses key attributes of a potential winner going forward considering its metrics. This is a good candidate for your watchlist. Looking at the chart below, you can see that the current $103 level has had major support and resistance, especially during the June 2001 to November 2021 period. Before taking any position, make sure the stock price exceeds its high $116 in October 2021, the MACD is positive (not currently the case), RT is above 1.00, and lastly that the price remains above its 40-DMA. Of course, only buy when the overall VectorVest stock market signal is “bullish” which is not the current situation. Check VectorVest’s recommendation on this stock after it breaches $116 to determine if there is a new “BUY” signal. Then make your decision. Analyze it for free using VectorVest.


Want These Types of Insights at Your Fingertips so You Can Win More Trades?
Use VectorVest to analyze any stock free. VectorVest is the only stock analysis tool and portfolio management system that analyzes, ranks and graphs over 18,000 stocks each day for value, safety, and timing and gives a clear buy, sell or hold rating on every stock, every day.
Before you invest, check VectorVest! Click here to ANALYZE ANY STOCK FREE and see our system in action!


Leave A Comment