
Written by: Angela Akers
The Fed’s preferred measure of inflation was released today, the Personal Consumptions Expenditures Index. The numbers came in higher than the previous month and higher than expected. The minutes of the Federal Reserve’s May meeting were released earlier this week showing Fed officials were split over a pause in rate hikes at the June meeting and the data would dictate the outcome. My assumption was that hotter-than-expected inflation would have a negative effect on stock prices today, but the market soared.
As I’ve said a few times this quarter, Q1 earnings are pretty good, better than expected in many cases. In fact, according to the FactSet Earnings Insight report, 97% of S&P500 companies have reported earnings, with 78% beating their earnings estimates and 76% beating their revenue estimates. But there was no tangible reaction from investors, until Nvidia released their earnings this week, beating expectations by a landslide, picking up a hefty 24% Thursday and bringing the Nasdaq and S&P500 with it.
While the rate at which inflation is growing has slowed from the lofty levels we saw in 2021 and 2022, it’s likely not enough for the Fed, which refers to magic levels of 2%. So, I agree that there are real underlying fears lingering; inflation, the Fed and interest rates, the dollar, and the debt ceiling. With all the facts and data thrown at investors, it becomes hard to see the forest through the trees and the day’s headline becomes the longer-term narrative, ie. reality is negated by what is perceived.
It takes me back to an Essay I wrote on June 3, 2022, entitled, “A Caveman Investor.” The Essay was inspired by an email that I received from Dr. DiLiddo. In that email, he related the evolution of investors to the evolution of man. And with only 230 years under our belts, investing is still in the infancy stage and that is why perception is the reality.
Let’s revisit reality. In the VectorVest software, pull up a 1-year Market Climate Graph (Click on Graphs, then the arrow to the right of Stock in the upper left corner of the screen and select Market Climate). Add the 50 MA EPS and the ETI. We can see that the 50 MA EPS hit a peak of $9.65 on July 15, 2022, and began falling. High inflation and rising interest rates had begun to make it harder for companies to make money. As of July 15, 2022, the ETI was at a pretty lofty level of 1.31, and while it had already been suffering by then, the bleeding accelerated.
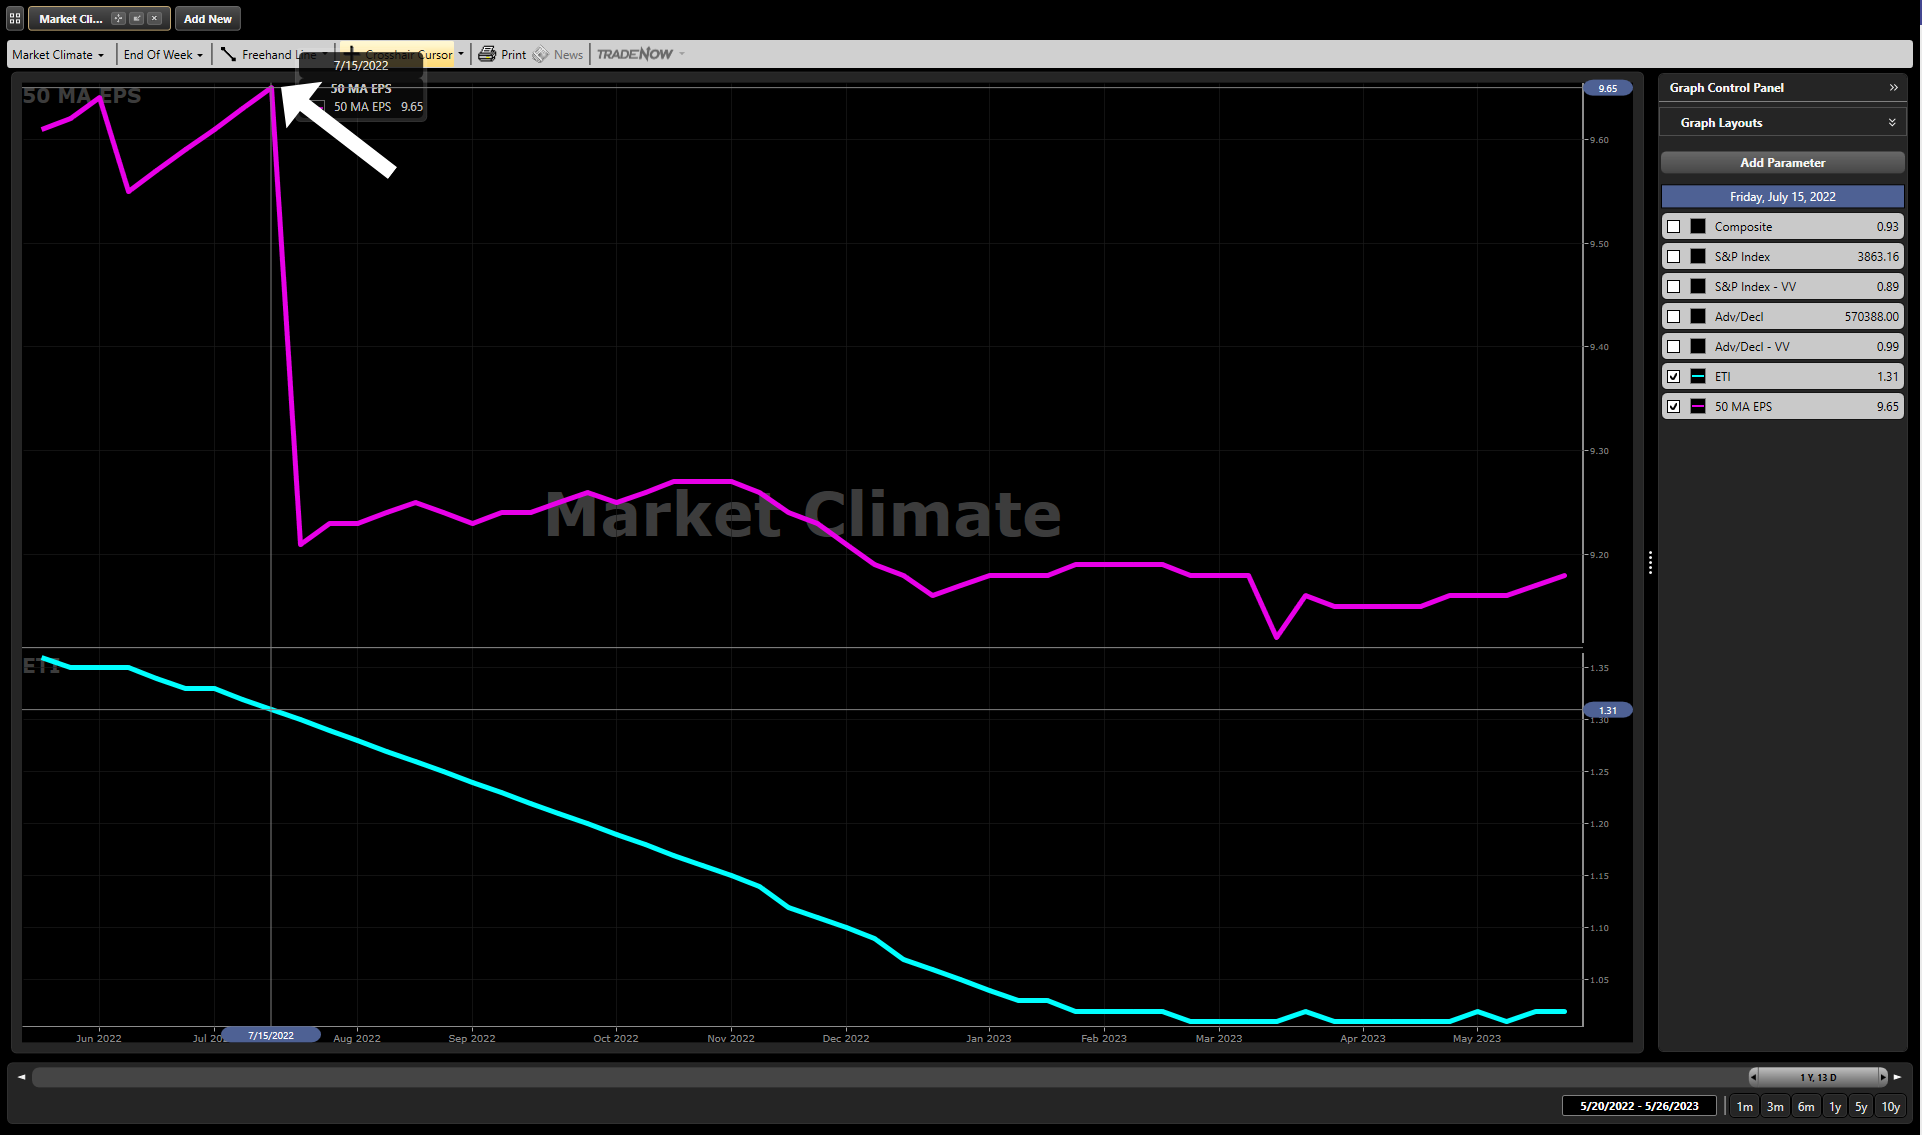
The 50 MA EPS hit a 1 year low of $9.12 on March 17, 2023, by then the ETI was hanging on at 1.01. Q1 2023 earnings began to filter in, along with new/revised full-year forecasts and the 50 MA EPS started rising again. It now stands at $9.18 and the ETI has now risen to 1.02.
I don’t know whether these indicators will continue in this direction, but I do know that today, the reality is not as grim as the popular perception. Rising earnings are the key to both a company’s and the overall market’s long-term success.
VectorVest’s philosophy is to buy safe, undervalued stocks rising in price when the market is rising. It doesn’t have to be complicated. VectorVest was designed to conduct an objective, unemotional, factual analysis of all the data that makes it seem complicated and turns it into actionable information and guidance. In this week’s “Special Presentation,” Mr. Steve Chappell will show us where this information and guidance are housed and how to get the most out of it. It’s a good time to Get Back To The Basics.


Want These Types of Insights at Your Fingertips so You Can Win More Trades?
Use VectorVest to analyze any stock free. VectorVest is the only stock analysis tool and portfolio management system that analyzes, ranks and graphs over 18,000 stocks each day for value, safety, and timing and gives a clear buy, sell or hold rating on every stock, every day.
Before you invest, check VectorVest! Click here to ANALYZE ANY STOCK FREE and see our system in action!


Leave A Comment