Interactive Brokers (NASDAQ:IBKR) is a highly automated global broker that offers low-cost seamless access to multiple asset (stocks, options, futures, forex, commodities, bonds, crypto, mutual funds and ETFs) to its two million client accounts composed of individuals, institutions,
introducing brokers, and financial advisors. The firm operates in over 150 market centers in 33 countries and 26 currencies. The firm had its IPO in 2007, focused exclusively on brokerage instead of market making in 2016, introduced zero commissions in 2019, and launched crypto trading in 2021.
The firm has a total market capitalization of $27 billion and total assets of $115 billion. Currently, IBKR handles over three million trades a day for its clients. Its trading platform had been rated highly by Barron’s as the #1 Best Online Broker in 2022, as well as #1 for Active Traders. Their IB SmartRouting order processing provides the best price execution, and the firm does not sell its client order flow for IBKR-PRO clients. Moreover, their low margin rates ranging between 5.33% to 6.08% for their IBKR Pro customers are the lowest in the industry, in most cases by more than 50%.
IBKR has a forecasted earnings per share of $5.11 and a current P/E ratio of 16.97 compared to a 47.88 P/E of all VectorVest monitored stocks. That means it is above average in this metric which is a positive attribute. It pays an $0.40 annual dividend with a dividend yield of 0.46%. well below the average stock’s 1.10% yield. IBKR 12-month sales growth was an exceptional 122%, outpacing all other firms in its category.
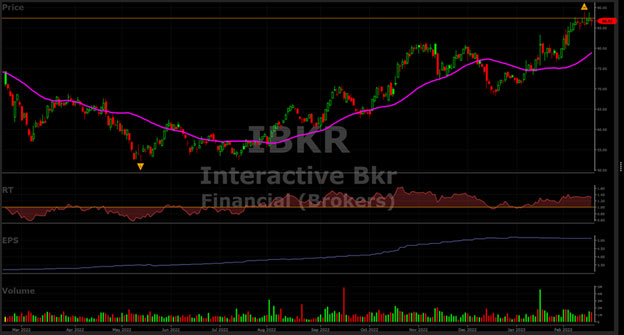
From its March 23, 2020 low of $33.70 to its closing price of $86.72 on February 17, 2023, IBKR has advanced 157% compared to 86% for the S&P 500 and 75% for the VectorVest Composite for the same time period. Currently, the stock price is comfortably above its 40-day moving average and consolidating over the past nine days. An upside breakout appears imminent, but it is necessary to see how the overall market behaves after President’s day. A reversal to the downside is possible if the market takes a breather, after its 6.2% year-to-date gain in the S&P 500. IBKR is the 3rd highest VST performer out of 37 companies in the brokerage industry tracked by VectorVest. The average trading volume is just over one million shares a day.
High VectorVest Scores Projects a Bright Future
The VectorVest ratings of IBKR are as follows:
- Excellent Upside Potential: The Relative Value (RV) rating focuses on a stock’s long-term, three-year price appreciation potential. The current RV rating for IBKR is 1.50 – appreciably above the 1.00 level on a scale of 0.00-2.00. VectorVest’s current value of the stock is $109.67, well-above its current price of $86.72; therefore it is considered undervalued, with room to run to exceed its February 14, 2023 intraday all-time high of $88.97, only a 2.65% jump from its closing price on February 17.
- Good Safety: The Relative Safety (RS) rating is based on the company’s business longevity, financial predictability/consistency, debt-to-equity ratio, and additional risk parameters, including price volatility. The RS rating of 1.17 is marginally above average, indicating minimal risk.
- Very Good Timing: The Relative Timing (RT) rating focuses on the price trend over the short, medium, and long term. The components include price direction, dynamics, and price magnitude of price changes over daily, weekly, quarterly, and yearly comparisons. IBKR has an above average RT rating of 1.32 compared to the average 1.02 RT of all the stocks in the database.
- Fair Comfort Index: This index measures the consistency of a stock’s long-term resistance to severe and lengthy corrections. This index compares the individual stock to the fluctuation of the VectorVest Composite price that is measured on a scale of 0 to 2.00. At a level of 1.06, IBKR is about average of all rated stocks. Therefore, this stock may not be suitable for all long-term conservative investors.
- Excellent Earnings Growth Rate (GRT): IBKR’s 28% forecasted growth rate is well above average and is measured over a forecasted three-year period. This fundamental factor is calculated in the VectorVest software, so you don’t have to do the work. A 5-year chart highlights the up-trending earnings with an accelerating move higher after January 2020.
- Very Good VST Score: The VST Master Indicator ranks 9,165 stocks from high to low and brings to the top of the rankings those stocks with the highest VST scores. IBKR’s exceptional score is 1.33 which is the upper 10% of the entire database, quite an accomplishment. Using VST enables users to determine stocks that are performing much better than average, as well as the opportunity to find the cream of the crop in all its critical criteria with a few mouse clicks.
Considering the high VectorVest scores, is this a safe time to buy IBKR, as it hit its all-time high this past week? Or, is it about to give back some of those recent gains to test the $77- $81 support area, before its next move higher? Check out VectorVest’s ratings on this stock before making any move. To see the IBKR rating you can analyze IBKR free using VectorVest to get the recommendation.


Want These Types of Insights at Your Fingertips so You Can Win More Trades?
Use VectorVest to Analyze any stock free. VectorVest is the only stock analysis tool and portfolio management system that analyzes, ranks and graphs over 18,000 stocks each day for value, safety, and timing and gives a clear buy, sell or hold rating on every stock, every day.
Before you invest, check VectorVest! Click here to ANALYZE ANY STOCK FREE and see our system in action!


Leave A Comment