By Leslie N. Masonson, MBA
Interactive Brokers (NASDAQ: IBKR), founded in 2007 and headquartered in Greenwich, CT, is a highly automated global broker that offers low-cost, seamless access to multiple assets, including stocks, options, futures, forex, commodities, bonds, crypto, mutual funds, and ETFs. It serves over two million clients, including individuals, institutions, introducing brokers, and financial advisors. The firm operates in more than 150 market centers across 33 countries and 26 currencies. The firm exclusively focuses on brokerage, as it discontinued market making in 2016. It introduced zero commissions in 2019 and launched crypto trading in 2021.
The firm has a total market capitalization of $8.5 billion and total assets of $115 billion. Currently, IBKR handles over three million trades a day for its clients. Its trading platform had been rated highly by Barron’s as the #1 Best Online Broker in 2022, as well as #1 for Active Traders. Their IB SmartRouting order processing provides the best price execution, and the firm does not sell its client order flow for IBKR-PRO clients. Moreover, they offer the lowest margin in the industry, in most cases by more than 50% lower. IBKR Pro customers pay 6.33% for accounts ranging from $100,000 to $1 million.
In its latest Q3 2023 Earnings Call, IBKR reported an EPS of $1.55, surpassing the Wall Street estimate of $1.48. Account growth came in at 21% with 140,000 new accounts in the latest quarter, and net revenues were over $1 billion for the third quarter in a row.
The company has a forecasted earnings per share of $5.98 and a current P/E ratio of 13.25 compared to a 50.28 P/E of all VectorVest monitored stocks. That means it is above average in this metric which is a positive attribute. It has a dividend yield of 0.50% which is below the average stock’s 1.26% yield which is not a positive. Moreover, IBKR’s Chairman Thomas Peterffy indicated that the company is not considering raising its dividend.
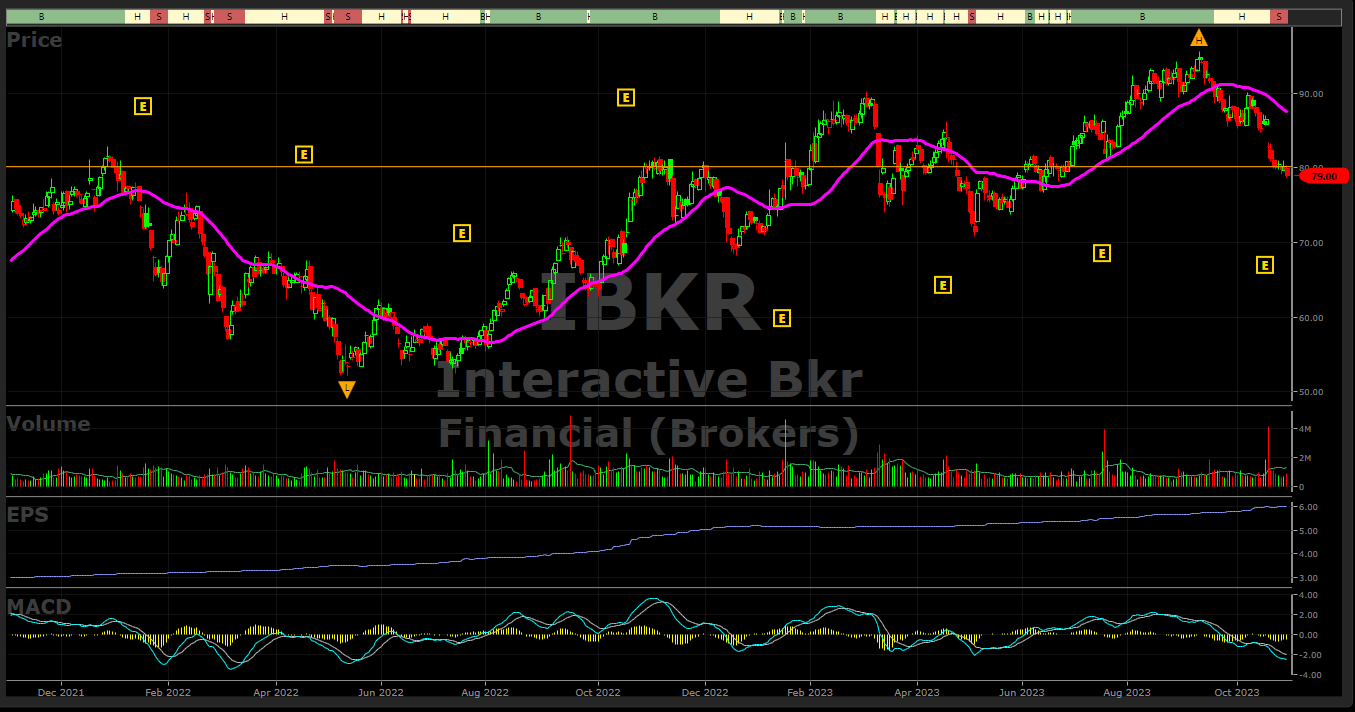
I last reviewed Interactive Brokers in this blog on February 20, 2023 when its price was $87. Since then it has had a rough eight months. It declined to $70.83 on May 4, 2023, and then proceeded to move higher in a roller-coaster fashion before reaching an all-time high of $94.47 on September 11. It then began its next descent to near $80 during the last five days, a decline of 15.3% in six weeks. The current price is at critical support/resistance level. Between 2018 and the current date, the $80 price level was resistance six times. Now that level is considered support, so we will see if support holds here. The stock has a Beta 0.77 which is 23% less volatile than the S&P 500 Index. Its Friday close of $79.23 is not good news to those investors considering a potential purchase.
Interactive Brokers’ Above Averages VectorVest Scores Projects a Bright Future, But the Stock is Currently Rated a “Sell” Due to Its Recent Price Deterioration and Market Correction
The VectorVest software issues buy, sell, or hold recommendations on 9,154 stocks/ETFs. This proprietary stock rating system splits the data into three simple ratings: relative value (RV), relative safety (RS), and relative timing (RT). Each is measured on a scale of 0.00-2.00, with 1.00 being the average for quick and easy interpretation, and 2.00 being the best.
The VectorVest ratings of IBKR are as follows:
- Excellent Upside Potential: The Relative Value (RV) rating focuses on a stock’s long-term, three-year price appreciation potential. The current RV rating for IBKR is 1.61 – appreciably above the 1.00 level on a scale of 0.00-2.00 and above the 1.52 level last February 20. VectorVest’s current value of the stock is $128.96 compared to $109.67 last February 20, and its current price of $79.23; therefore it is considered undervalued, with room to run and potential take out it's all-time high of $94.47, when it and the market recovers from the latest multi-month drubbing.
- Very Good Safety: The Relative Safety (RS) rating is based on the company’s business longevity, financial predictability/consistency, debt-to-equity ratio, and additional risk parameters, including price volatility. The RS rating of 1.37 (compared to 1.17 in February) is above average, indicating minimal risk. Therefore, this stock may be suitable for all long-term conservative investors.
- Fair Timing: The Relative Timing (RT) rating focuses on the price trend over the short, medium, and long term. The components include price direction, dynamics, and price magnitude of price changes over daily, weekly, quarterly, and yearly comparisons. IBKR has a below average RT rating of 0.88 compared to 1.32 in February which was above average) compared to the average 0.75 RT of all the stocks in the database.
- Good Comfort Index: This index measures the consistency of a stock’s long-term resistance to severe and lengthy corrections. This index compares the individual stock to the fluctuation of the VectorVest Composite price that is measured on a scale of 0 to 2.00. At a level of 1.12 (compared to 1.06 in February), IBKR is a bit above average of all rated stocks. Therefore, this stock may be suitable for all long-term conservative investors.
- Excellent Growth Rate (GRT): IBKR’s 27% forecasted growth rate is well above average and is measured over a forecasted three-year period. Its sales growth of 80% per year is exceptional. This fundamental factor is calculated in the VectorVest software, so you don’t have to do the work. A 5-year chart would show the up-trending earnings with an accelerating move higher after January 2020.
- Very Good VST Score: The VST Master Indicator ranks 9,154 stocks from high to low and brings to the top of the rankings those stocks with the highest VST scores. IBKR’s exceptional score is 1.29 (compared to 1.33 in February) which is the upper 1% of the entire database, quite an accomplishment. Using VST enables users to determine stocks that are performing much better than average, as well as the opportunity to find the cream of the crop in all its critical criteria with a few mouse clicks.
Considering the S&P 500’s overall decline since its late July/early August highs, and IBKR’s 15% decline since September 11, and its “Sell” rating, this stock should be placed on a watchlist awaiting a market reversal. Before stepping in make sure IBKR is on a “Buy” signal, and that the Daily Color Guard confirms it. Do not expect to get in at the bottom, but until it rebounds and both previously mentioned signals are positive coupled with a MACD a positive crossover. Conservative investors interested in buying this stock should wait for its price to cross over its 40-dma.
Check out VectorVest’s future ratings on this stock before making any move. To see the IBKR rating you can analyze IBKR free using VectorVest to get the recommendation.


Want These Types of Insights at Your Fingertips so You Can Win More Trades?
Use VectorVest to analyze any stock free. VectorVest is the only stock analysis tool and portfolio management system that analyzes, ranks and graphs over 18,000 stocks each day for value, safety, and timing and gives a clear buy, sell or hold rating on every stock, every day.
Before you invest, check VectorVest! Click here to ANALYZE ANY STOCK FREE and see our system in action!


Leave A Comment