by Leslie N. Masonson, MBA
Last week, I reviewed leveraged bullish ETFs. Now, I’ll focus on the polar opposite – bearish leveraged (inverse) equity ETFs. In total, there are 162 equity leveraged ETFs valued at $71.6 billion with an average expense ratio of 1.02%. As a subset, inverse leveraged equity ETFs account for 67 ETFs with $14.4 billion AUM with a 1.04% average expense ratio.
Those ETFs sport various levels of leverage from 1 (no leverage just a 1:1 relationship), to 2 and 3 times their underlying benchmark. VectorVest labels inverse ETFs as “contra” ETFs which increase in price when their benchmark falls. Here, I will only focus on the equity leveraged bear ETFs. I did not include the handful of leveraged fixed income and commodity ETFs for this discussion to keep things simple and directly comparable.
Instead of shorting stocks or standard ETFs in a margin brokerage account, investors and traders can use inverse ETFs without incurring borrowing costs and the possibility that there are no shares available to short. These ETFs are bought long with no margin requirement. Moreover, inverse ETFs can be purchased in retirement accounts.
The two foremost ETF sponsors in this inverse category are ProShares and Direxion. The minor players include REX Microsectors (FNGD, NRGD, GDXD, BNKD, BERZ, OILD, and FLYD), AXS Investments (SARK), and Advisor Shares (HDGE, DWSH).
Most importantly, these ETFs offer their stated leverage ratio on only a one-day basis, as the pricing is reset every day. This means that if you buy a Proshares UltraPro Short QQQ (SQQQ) which is -3X the QQQ, it will rise 3% when the QQQ falls 1% and it will lose 3% when the QQQ’s gains 1%.
Over periods longer than one day this 3:1 relationship will not hold up, especially in a trading range or advancing market scenario. In both these cases, SQQQs will perform poorly and quickly lose value, as the ETF’s price accelerates higher. There is a daily reset each night where the price is reset to its underlying benchmark so the fixed ratio (for example 3:1), is maintained going forward.
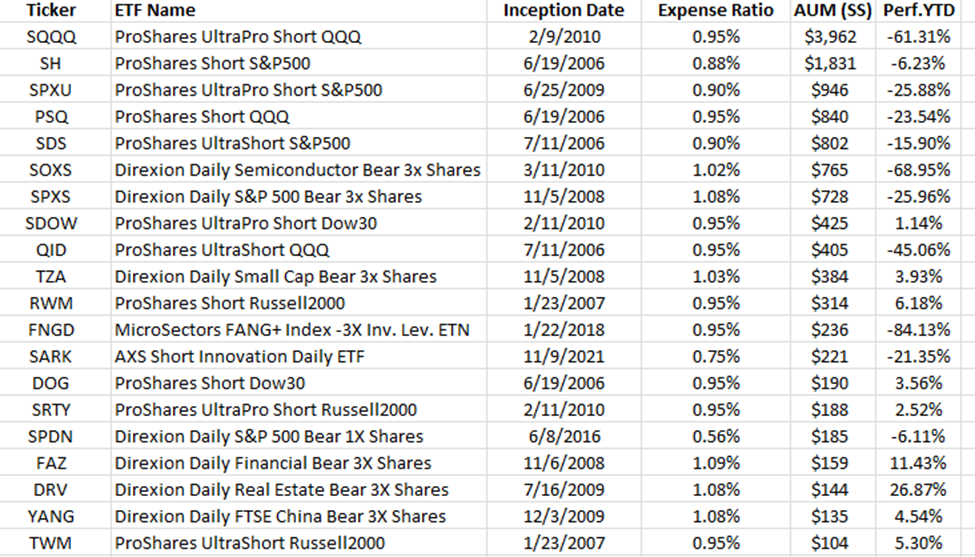
The 20 largest inverse equity leveraged ETFs, as of October 20, 2023 are as follows:
.
Surprisingly, of the top 20 ETFs ranked by AUM, eleven have a positive return in 2023. FAZ and DRV have the highest positive returns of 11.4% and 27%, respectively. FAZ is in the financial and banking space, and DRV is in the real estate sector.
On the flip side, anyone holding technology or semiconductor inverse ETFs (or those who shorted the stocks in that category) got clobbered, as those two sectors have risen 30% or more for the year. The worst of the bunch is FNGD (3X) down 84%, while SOXS declined 69%, and SQQQ fell 61%. If you recall from last week’s ETF article, the top performing bullish ETF was FNGU (Microsectors Fang +3x ETN) which is a 3X FANG ETF which had a phenomenal 2023 return of 282% as of October 6. However, with the market falling this past week, FNGU lost 10% for the week while FNGD gained 9.9%.
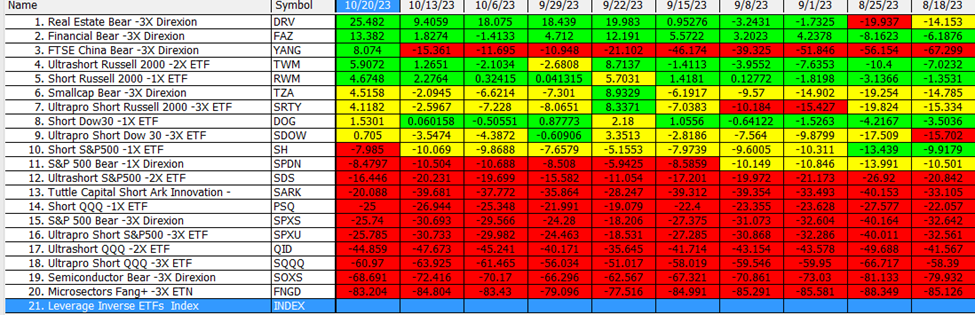
The table below shows a portion of the leveraged inverse performance for 2023 through October 20 (or the last 42 weeks).
.
Each dated column shows the performance for the last 42 weeks. So, DRV has advanced 25.48% year-to-date ending October 20, and was up only 9.41% for the 42 weeks ending October 13. The five top performing inverse ETFs so far this year are DRV, FAZ, Yang, IWM, and RWM, with the first three being triple-leveraged, while TWM is double-leveraged, and RWM is single-levered (just the opposite of its benchmark without leverage).
Relative strength analysis (percent change over a time period) of ETFs using any timeframe (e.g., weekly, bi-weekly, monthly) will identify the top performers. Clearly, in the above example, FAZ has been one of the top performers in all of the 42-week periods on the table since August 18. Also, notice that FAZ first positive 42-week return came on September 1. Looking at a chart of the S&P 500 (not shown here) on that date and going forward, one will observe that it was an excellent entry point for a short on the market. So FAZ provided an early warning of a coming market decline as it finally had a positive 42-week performance.
Aggressive, self-directed investors and traders searching for extraordinary returns, and willing to stomach extreme volatility, can trade these leveraged ETFs. There are both full- and part-time players, willing to place small or large bets on these inverse vehicles. Clearly, inverse leveraged ETFs should not be part of 99% of investors’ portfolios, as they can collapse in price if you are long these ETFs and the market rises. Only the well-informed, educated, and decisive individuals with the ability to cut their losses short should consider these ETFs.
Moreover, the individual must be highly disciplined, unemotional and have strict unyielding risk rules in place to avoid large losses. VectorVest subscribers can take advantage of inverse ETFs when the Daily Color Guard is “Bearish” with three red lights (maximum), as signaled on October 19, and 20. Also, note that the top performing Derby search on October 20 was “Worst Performing Contra ETFs –C/Dn (Bearish Long) was a gain of 4.26% as the S&P 500 and Nasdaq Composite lost more than 1.25%. And that search was mentioned in the Views on that same day. So consider using inverse ETFs at this market juncture, but be cautious as a possible relief rally may occur, as the market has been falling since September 1.
Anyone interested in learning more about these ETFs should definitely review each sponsor’s prospectus, fact sheet, and other material at the firm’s website. Make sure you understand how the ETF operates, and how the daily price reset and compounding works since they have a major impact on daily prices. And then use the ETF viewer to determine the top ranked inverse ETFs accompanied by a continued DCG bearish signal. Of course, when the DCG signals a ‘Bull” signal it would be time to get out of that position.


Want These Types of Insights at Your Fingertips so You Can Win More Trades?
Use VectorVest to Analyze any stock free. VectorVest is the only stock analysis tool and portfolio management system that analyzes, ranks and graphs over 18,000 stocks each day for value, safety, and timing and gives a clear buy, sell or hold rating on every stock, every day.
Before you invest, check VectorVest! Click here to ANALYZE ANY STOCK FREE and see our system in action!


Leave A Comment