
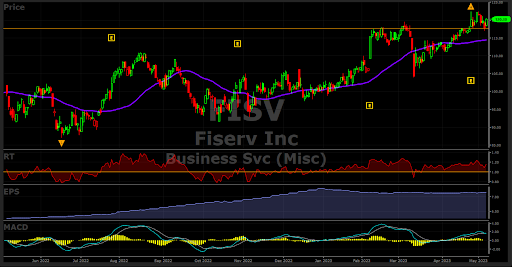
Fiserv, Inc. (FISV: Nasdaq), a financial services company headquartered in Brookfield, Wisconsin, has been steadily approaching the upper range of its trading levels, a range that was initially reached on March 4, 2020, when the stock hit $123.89. This approximate level has been revisited twice more since then, first on April 26, 2021, at $121.66, and most recently on April 25, 2023, at $122.39, thus forming what technical analysts refer to as a “triple top formation.” As of May 5, 2023, the stock closed at $120.30, just shy of the April high. A decisive breakthrough above $124 could potentially pave the way for further gains, as there is currently no significant resistance from previous price levels.
Fiserv operates through its various subsidiaries and offers a range of global money, payment, and information services across three key business segments: Acceptance, Fintech, and Payments. Its extensive suite of services includes cloud-based point-of-sale solutions, account processing, digital banking, debit and credit card services, bill payment, and money transfers, as well as merchant and banking services management, security, and fraud protection.
In its press release issued on April 25, 2023, which contained the earnings report for the first quarter of that year, Fiserv announced a 10% increase in revenue to $4.55 billion. Adjusted earnings per share also witnessed a healthy rise of 13% to $1.58, and free cash flow expanded to $861 million compared to $603 million in the corresponding quarter of 2022. Recognizing its innovation, Fortune magazine honored Fiserv as one of the most innovative companies in America, while Forbes magazine ranked it among the country’s best large employers, boasting a workforce of 41,000 full-time employees.
Let’s delve into Fiserv’s financials. With a current market capitalization of $74.3 billion and a relatively low price-to-earnings (P/E) ratio of 16.80, significantly lower than the average VectorVest stock with a P/E ratio of 47.39, Fiserv appears favorably priced. Moreover, the company has projected earnings per share of $7.16 for the upcoming year, indicating a promising growth potential. Currently, there are 617 million common shares outstanding, and Fiserv enjoys considerable institutional and mutual fund ownership, being widely regarded as a solid company.
A notable aspect to highlight is the ownership distribution. While 1,876 institutions hold Fiserv’s stock in their portfolios, with TRowe Price owning 8.6% of the outstanding shares, The Vanguard Group, Inc. at 8.2%, and Blackrock with 6.8%, insiders only own a mere 0.53%, which is an unusually low figure. Typically, insiders hold a more substantial stake, ranging from 10% to 30%. This relatively low insider ownership should be viewed as a concern. Additionally, it is worth mentioning that Fiserv does not pay a dividend.
In terms of rankings, FISV holds the top spot among 124 Business Services (Misc.) stocks in the VectorVest universe. It also claims the first position out of 277 stocks in the broader Business Services sector, a significant achievement among numerous highly-rated companies. While the company forecasts an impressive earnings growth rate of 21% for the next year and maintains a steady year-over-year performance, it is important to acknowledge that its business sector ranks only 133rd out of 222 sectors (60th percentile) based on Relative Timing (RT) measurement. This suggests that the sector is not among the strongest trending sectors.
Fiserv’s (FISV) stock price is currently trading 5% above its 40-day moving average, suggesting that it is not overextended. This indicates a level of stability in the market. Furthermore, since early April, the Moving Average Convergence Divergence (MACD) indicator has remained positive, signifying that the short-term upward trend in the stock price is still intact. These technical indicators provide some insight into the current state of the stock and its potential trajectory. For those investors who are more adventurous and willing to take on additional risk, call and put options are available for trading. Options provide traders with the opportunity to speculate on the future direction of the stock price. If you have never traded options or want to learn more consider one of VectorVest University’s seven options courses to enhance your knowledge.
FISV Has Very Good VectorVest Scores, Is Undervalued, But Has 1.43 Beta Indicating High Volatility
Before investing, make sure to understand and review VectorVest’s FISV’s key metrics:
- Excellent Upside Potential: The Relative Value (RV) rating focuses on a stock’s long-term, three-year price appreciation potential. The current RV rating for FISV is 1.49 which is much higher than the average on a scale of 0.00-2.00. VectorVest’s current stock value is pegged at $158.82 with a current price of $120.30; therefore, it is undervalued and worth more than the market’s current price.
- Excellent Safety: The Relative Safety (RS) rating is based on the company’s business longevity, financial predictability/consistency, debt-to-equity ratio, and additional risk parameters, including price volatility. Its RS rating of 1.41 is well above average, indicating below-average risk.
- Good Timing: The Relative Timing (RT) rating focuses on the price trend over the short, medium, and long term. The components include price direction, dynamics, and price magnitude of price changes over daily, weekly, quarterly, and yearly comparisons. FISV has a slightly above-average RT rating of 1.16 compared to the average 0.88 RT of all the stocks in the database which means that the stock has been performing slightly better than average over multiple timeframes.
- Good Comfort Index: This index measures the consistency of a stock’s long-term resistance to severe and lengthy corrections. This index compares the individual stock to the fluctuation of the VectorVest Composite price that is measured on a scale of 0 to 2.00. At a level of 1.10, FISV’s rating is slightly above average. Therefore, this stock can be considered more aggressive than conservative investors.
- Excellent Earnings Growth Rate (GRT): FISV’s solid 21%forecasted growth rate is measured over a forecasted three-year period. This fundamental factor is calculated in the VectorVest software, so you don’t have to do the work. The chart below highlights the positive earnings trend over time, but the earnings flattened out over the most recent period.
- Very Good VST Score: The VST Master Indicator ranks 9,139 stocks from high to low and brings stocks with the highest VST scores to the top of the list. FISV’s high score is 1.35. Using VST enables users to identify stocks that are performing much better than average, as well as the opportunity to find the cream of the crop in all its critical criteria with a few mouse clicks. This stock is definitely in that group as it is in the top ½ of 1% of all stocks evaluated. Because of its volatility, investors are urged to place their stop-loss orders as soon as the stock is purchased to avoid big losses.
Considering the three “excellent” ratings on these metrics, this stock is one of the highest-rated ones in its universe. Therefore, consider adding FISV to your watchlist for a potential buying opportunity after doing your due diligence (checkout the May 2 Q1 2023 earnings call transcript on the company website www.fiserv.com), and only when the overall VectorVest stock market signal is “bullish” which is not the current situation.
Determine VectorVest’s position on this stock as it approaches the top of its 2.5 year trading range. Analyze it for free using VectorVest


Want These Types of Insights at Your Fingertips so You Can Win More Trades?
Use VectorVest to analyze any stock free. VectorVest is the only stock analysis tool and portfolio management system that analyzes, ranks and graphs over 18,000 stocks each day for value, safety, and timing and gives a clear buy, sell or hold rating on every stock, every day.
Before you invest, check VectorVest! Click here to ANALYZE ANY STOCK FREE and see our system in action!


Leave A Comment