While Airbnb (ABNB) reported an impressive 1st quarter earnings report after the market closed Tuesday. Revenue and EPS both beat analyst estimates.
But, a negative outlook for the current quarter and the remainder of 2023 had the market in a frenzy – sending shares more than 13% lower in Wednesday’s trading session yesterday. This was the largest single-day drop since 2020.
For the 1st quarter, Airbnb reported revenue of $1.8 billion – narrowly beating the analyst estimate of $1.79 billion. Meanwhile, EPS of 18 cents outperformed the estimate of 12 cents. Management also approved a stock buyback program of $2.5 billion. But, that’s where the good news ends.
The company took a step backward in Nights and Experiences Booked, a key metric indicating the overall health of the company. The figure of 121.1 million fell short of the 122.4 million estimate. Moreover, Airbnb weakened its outlook for the current quarter – and could potentially come in under the analyst estimate of $2.42 billion with somewhere between $2.35 billion – $2.45 billion.
After this lackluster outlook, analysts across the market cut their price targets. The main concern is the slowing growth in Nights and Experiences Bookings – despite efforts to reduce prices for consumers.
With that said, Airbnb executives are optimistic about the road ahead. The upcoming summer will be one of the biggest for travel since prior to the pandemic. The company has invested heavily in promotional efforts to capitalize on this season.
We last wrote about Airbnb in February of this year when the stock was sitting at around $145 and had excellent timing. A lot has changed since then, though. Today, the stock sits at just $111. So, let’s take an updated look at ABNB through the VectorVest stock analyzing software to help you determine if it’s time to consider selling.
Two Reasons We’re Concerned About ABNB: Safety & Timing
The VectorVest system simplifies your trading strategy through a proprietary stock rating system. You can win more trades with less time and effort, as you’re given all the insights you need in 3 ratings: relative value (RV), relative safety (RS), and relative timing (RT).
Each of these sits on its own scale of 0.00-2.00, with 1.00 being the average. This makes interpretation quick and easy, as you can simply pick stocks with higher ratings than the average to win more trades.
Or, better yet, follow the clear buy, sell, or hold recommendation the system offers for any given stock, at any given time. As for ABNB, we see 2 issues right now - here’s what you need to know:
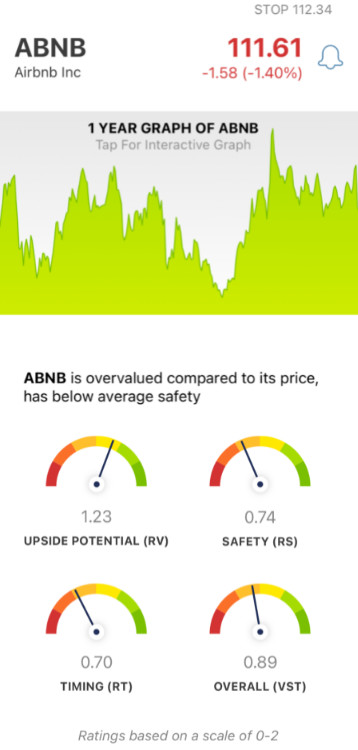
- Good Upside Potential: Despite the adverse market reaction to Tuesday’s earnings report, ABNB still has a good RV rating of 1.23. This is a comparison of the stock’s long-term price appreciation potential to AAA corporate bond rates and risk. However, the stock is overvalued - with a current value of just $58.
- Poor Safety: A lot has changed since we discussed the state of ABNB 3 months ago - but one thing has remained consistent. The stock still has poor safety. The RS rating of 0.74 is derived by analyzing the company’s financial consistency & predictability, debt-to-equity ratio, and business longevity.
- Poor Timing: The biggest issue for ABNB right now is the negative price trend that has gripped the stock. The RT rating of 0.70 is poor, and is based on the direction, dynamics, and magnitude of the stock’s price movement. It’s calculated day over day, week over week, quarter over quarter, and year over year.
All things considered, the overall VST rating of 0.89 is a ways below the average - but considered fair nonetheless. So, what does that mean for you as an investor - if you hold ABNB right now, is it officially time to get out before things get worse? Or, on the other hand, is this a good time to get into ABNB at a better value?
Don’t play the guessing game or let emotion influence your next move - get a clear buy, sell, or hold recommendation at VectorVest with a free stock analysis today!


Want These Types of Insights at Your Fingertips so You Can Win More Trades?
Use VectorVest to analyze any stock free. VectorVest is the only stock analysis tool and portfolio management system that analyzes, ranks and graphs over 18,000 stocks each day for value, safety, and timing and gives a clear buy, sell or hold rating on every stock, every day.
VectorVest advocates buying safe, undervalued stocks, rising in price. Right now, ABNB has good upside potential. But that’s where the good news ends. The stock has poor safety and timing after a negative outlook for the current quarter in Tuesday’s earnings report.
Before you invest, check VectorVest! Click here to ANALYZE ANY STOCK FREE and see our system in action!


Leave A Comment