On Friday, John Deere (DE) reported fiscal 2nd quarter earnings that came in well above analyst expectations. And yet, the stock closed lower than it opened at. And so far in Monday’s trading session, DE is picking up where it left off – heading down lower and lower.
The company has only failed to surpass consensus EPS estimates once in the past 4 quarters. Looking back even further, the company has outpaced projections for 8 of the last 9 quarters. It seems as if every time we talk about John Deere the company is performing better than expected.
This time, the company posted revenue of $16.08 billion – walloping the figure from this time last year of $12.03 billion. This was more than 8% higher than analysts were projecting. But more importantly, profit grew by more than 36%.
Much of this can be attributed to a boost in the company’s production and precision agriculture division. While material and logistic costs are up, the company raised prices with no hit to sales.
Quarterly earnings for the period ended April 2023 were $9.65 per share, exceeding the estimate of $8.57 by a wide margin. This figure also represents a dramatic improvement from the same quarter last year, where EPS was $6.81.
Looking ahead to the future, John Deere doesn’t expect demand to slow down. Rather, orders booked appear to be rising for the remainder of the year. This has resulted in the company raising the forecast for the remainder of 2023. Now, the net income target will fall between $9.25 billion to $9.50 billion – up from the previously projected $8.75 billion to $9.25 billion.
Still, the company’s stock fell on this news – quite the surprise for investors and the market as a whole. Some experts suggest that the increase in orders is going to lead to oversupply. Other analysts suggest that the drop in share price is the result of investors taking their profits and running.
The stock has been on a downward trajectory for some time before all this news. In the past 3 months, share prices have fallen more than 17%. Meanwhile, the S&P 500 index has climbed in that same period.
Whatever the case, you’re wondering what you should do with DE stock. And, we’ve analyzed it through the VectorVest stock analyzing software to help you find your next move and execute it with confidence.
While DE Has Excellent Upside Potential and Good Safety, the Timing is Poor For This Stock
The VectorVest system is based on a proprietary stock rating system that simplifies your trading strategy. You can win more trades with less work by relying on just 3 easy-to-understand ratings. These are relative value (RV), relative safety (RS), and relative timing (RT).
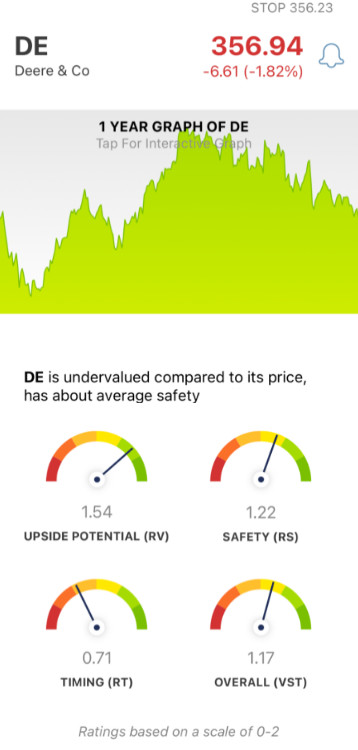
Each of these ratings sits on a scale of 0.00-2.00, with 1.00 being the average. This allows for effortless interpretation. But it gets even easier. Because based on the overall VST rating for a stock, the system gives you a clear buy, sell, or hold recommendation - at any given time. As for DE, here’s what we’ve unearthed:
- Excellent Upside Potential: The RV rating is a comparison between a stock’s 3-year price appreciation potential, AAA corporate bond rates, and risk. Right now, the RV rating is excellent at 1.54 for DE - and, the stock is undervalued. The current value is $544 per share.
- Good Safety: The RS rating is an indicator of risk, and takes into account the company’s financial consistency & predictability, debt-to-equity ratio, and business longevity. As for DE, the RS rating of 1.22 is good.
- Poor Timing: The one thing holding DE back right now is timing - with a poor RT rating of 0.71. This rating is based on the direction, dynamics, and magnitude of the stock’s price movement. It’s taken day over day, week over week, quarter over quarter, and year over year.
The overall VST rating of 1.17 is good for DE, but is it enough to justify a buy? Or, should you hold on a bit longer and wait for a more favorable price trend to form? Don’t play the guessing game or make a decision rooted in emotion. Get a clear answer on your next move at VectorVest with a free stock analysis today.


Want These Types of Insights at Your Fingertips so You Can Win More Trades?
Use VectorVest to analyze any stock free. VectorVest is the only stock analysis tool and portfolio management system that analyzes, ranks and graphs over 18,000 stocks each day for value, safety, and timing and gives a clear buy, sell or hold rating on every stock, every day.
VectorVest advocates buying safe, undervalued stocks, rising in price. Despite delivering another impressive earnings report and raising guidance for the full year, DE stock has poor timing right now - with share prices falling lower and lower. Still, the stock has good safety and excellent upside potential.
Before you invest, check VectorVest! Click here to ANALYZE ANY STOCK FREE and see our system in action!


Leave A Comment