By Leslie N. Masonson, MBA
Berkshire Hathaway Inc. Class B (BRKB: NYSE), based in Omaha, NE, and incorporated in 1998 is presided over by the world-renowned stock sage Warren Buffet (94), also known as the “Oracle of Omaha” and his young 99-year-old sidekick Charlie Munger. The company held its 2023 Annual Meeting on May 6 with approximately 40,000 shareholders from around the world listening to every word in their response to hours of questions and answers.
BRKB is one of the large, multinational conglomerates that was very popular in the 1960s, but has since gravitated to specific industries such as media, retail, banking, and mining, among others. Berkshire’s main business is property and casualty insurance and reinsurance, as well as participation in freight rail transportation, manufacturing, retailing, and services.
Berkshire Hathaway shares are available in A shares ($507,161) and the more affordable B shares ($330). Since January 4, 1999, through May 19, 2023, BRKB has advanced 609% vs. 241.3% for the S&P 500 benchmark, a tripling of that average’s performance. However, from November 30, 2018, thru May 19, they are both up 52%, as well as over the past 12 months where they both are up 6%. Thus, the aura of above-average market performance has been fading recently. Therefore, it appears time for the next generation of leaders to be appointed so they can re-invigorate this venerable hodge podge of companies.
Nonetheless, BRKB is an extremely popular holding among big money managers, with institutions holding 66.1% of the shares, but insiders only 0.37%. Moreover, a whopping 4,301 institutions hold shares in their portfolios. For example, Vanguard Group holds 142.8 million shares or 11% of all shares outstanding, followed as expected by the behemoths Black Rock Inc. at 8%, and State Street Corporation at 5.25%. Believe it or not, this blue-chip company pays no dividends.
Additionally, BRKB is ranked 18th out of 100 stocks in the VectorVest Diversified Company category, and that sector is ranked 17th out of 41 total sectors tracked. So BRKB is in the upper 20%, and upper 40%, of those categories respectively. Its P/E ratio of 22.8 compares to 48.7 for all VectorVest stocks. The average daily trading volume is 3.5 million shares, and its market cap is a massive $742.2 billion with a beta of only 0.88 which is 12% below that of the S&P 500
BRKB Has Three Poor VectorVest Scores, So the Buffett Golden Touch Since 1970 May Be Wearing Off
Although Berkshire is a unique and exceptional company, it appears to be spread out among too many disparate businesses to be a future market leader. VectorVest helps you make careful and unemotional investing and trading decisions. Just reading the financial media and buying the stocks that everyone is buying will not lead to success in the long run. Using VectorVest’s time-tested and back-tested approach will provide you with a hard-number analysis of what a stock or ETF is worth and whether it should be bought or sold. So, pay attention to the ratings below before making any investment decision.
Make sure to identify and review BRKB’s key metrics:
- Poor Upside Potential: The Relative Value (RV) rating focuses on a stock’s long-term, three-year price appreciation potential. The current RV rating for BRKB is 0.81 which is below average on a scale of 0.00-2.00. VectorVest currently pegs the stock’s value at $200.88 while the current price of $330.39 is in a faraway neighborhood.
- Good Safety: The Relative Safety (RS) rating is based on the company’s business longevity, financial predictability/consistency, debt-to-equity ratio, and additional risk parameters, including price volatility. Its RS rating of 1.15 is slightly above average, indicating that it is suitable for more conservative investors.
- Good Timing: The Relative Timing (RT) rating focuses on the price trend over the short, medium, and long term. The components include price direction, dynamics, and price magnitude of price changes over daily, weekly, quarterly, and yearly comparisons. BRKB has a slightly below-average RT rating of 1.10 compared to the average 0.92 RT of all the stocks in the database which means that the stock has been performing slightly better than average over multiple timeframes.
- Poor Comfort Index: This index measures the consistency of a stock’s long-term resistance to severe and lengthy corrections. This index compares the individual stock to the fluctuation of the VectorVest Composite price that is measured on a scale of 0 to 2.00. At a level of 0.86, BRKB’s rating is below average. Therefore, this stock should be considered by only more aggressive investors with an above-average appetite for market volatility.
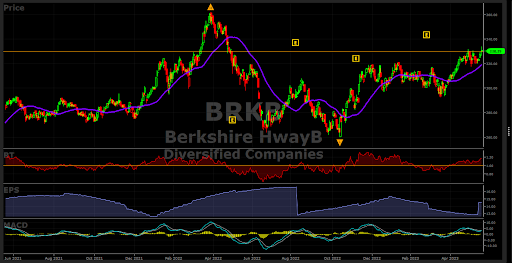
- Poor Growth Rate (GRT): BRKB’s 4% forecasted growth rate is measured over a forecasted three-year period. This fundamental factor is calculated in the VectorVest software, so you don’t have to do the work. The chart below highlights the choppy and inconsistent earnings trend over time, but with a slight bounce in their latest quarterly report. . Interestingly its sales growth of 21% is excellent.
- Fair VST Score: The VST Master Indicator ranks 9,133 stocks from high to low and brings stocks with the highest VST scores to the top of the list. BRKB’s just-above-average score is 1.04. Using VST enables users to identify stocks that are performing better than average, as well as those performing slightly worse than average. Unfortunately, BRKB falls in the latter category. Therefore, the stock is currently rated a “Hold”.
Considering the three “poor” metrics, this stock does not have the key attributes of a winner going forward. Nevertheless, you can consider adding BRKB to your watchlist for a possible small equity position if conditions change. Before jumping on board, first look to see if the stock price exceeds its high of around $365 last April, make sure the MACD stays positive and its RT holds above 1.00, the price remains above its 40-DMA, and only buy when the overall VectorVest stock market signal is “bullish” which is not the current situation. Check VectorVest’s recommendation on this stock after it breaches $10.19 to determine if there is a new “BUY” signal. Then make your decision. Analyze it for free using VectorVest.


Want These Types of Insights at Your Fingertips so You Can Win More Trades?
Use VectorVest to analyze any stock free. VectorVest is the only stock analysis tool and portfolio management system that analyzes, ranks and graphs over 18,000 stocks each day for value, safety, and timing and gives a clear buy, sell or hold rating on every stock, every day.
Before you invest, check VectorVest! Click here to ANALYZE ANY STOCK FREE and see our system in action!


Leave A Comment