
Last week, the stock market had its worst week in 2023 down about 2-3% depending upon the index selected, but Lantheus Holdings, Inc. (Nasdaq:LNTH) stock price jumped 21.3%. That was because its worldwide revenues for the fourth quarter and full year 2022, accelerated 103.1% and 119.9%, respectively, over prior year periods.
Although not a household name, LNTH is well-known in the healthcare diagnostic instrument sector. Its focus is on improving patient outcomes by providing clinicians with the tools to more accurately diagnose medical conditions. The company is a recognized leader in developing, manufacturing, and commercializing revolutionary diagnostic and therapeutic products using artificial intelligence software. The firm’s four key products are PYLARIFY™, DEFINITY®,AZDERA®, and TechneLite®. Originally founded in 1956 as New England Nuclear, it has grown significantly through key transformational acquisitions and mergers over the years. In 2015, it joined the Nasdaq.
LNTH has a P/E ratio of 18.47 compared to 47.03 for those companies in the VectorVest database and has a forecasted earnings per share of $3.92 for the next year ahead. One astonishing data point is the annual sales growth of 134% over the past year. Currently, no dividend is paid.
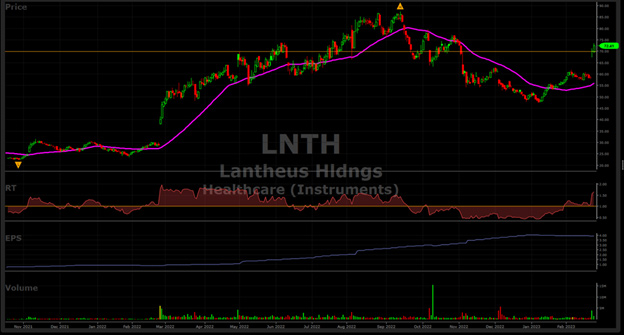
VectorVest ranks LNTH #1 in its universe of 533 healthcare sector stocks. Average daily trading volume of almost 950,000 makes it easy to get a good execution price. After its huge two-day run-up at the end of last week, this would not be a time to rush in and invest, as the price is stretched about 29% above its 40-day moving average. Instead, caution is urged here. Let the price settle down and wait for a better entry point.
Since its low price of $10.52 on November 5, 2020, LNTH’s stock price has appreciated a whopping 723%, to its closing high of $86.57 on September 12, 2022 compared to a measly gain of 17.3% in the S&P 500 Index. When a stock rises when the overall market is falling that is typically an indication of a potential leader when the market reverses higher. This is the type of stock that could fit that mold and have a solid 2023 performance. Definitely consider placing LNTH on your watchlist.
LNTH’s Solid VectorVest Scores Offers an Optimistic Future
The VectorVest ratings of LNTH are as follows:
- Excellent Upside Potential: The Relative Value (RV) rating focuses on a stock’s long-term, three-year price appreciation potential. The current RV rating for LNTH is 1.69– an exceptionally high rating on a scale of 0.00-2.00. VectorVest’s current value of the stock is 98.62, well-below its current price of $72.41; therefore it is considered undervalued, with room to run its recent high.
- Fair Safety: The Relative Safety (RS) rating is based on the company’s business longevity, financial predictability/consistency, debt-to-equity ratio, and additional risk parameters, including price volatility. The RS rating of .78 is marginally above average, indicating above average risk.
- Excellent Timing: The Relative Timing (RT) rating focuses on the price trend over the short, medium, and long term. The components include price direction, dynamics, and price magnitude of price changes over daily, weekly, quarterly, and yearly comparisons. LNTH has a significantly above average RT rating of 1.46 compared to the average 0.93 RT of all the stocks in the database.
- Good Comfort Index: This index measures the consistency of a stock’s long-term resistance to severe and lengthy corrections. This index compares the individual stock to the fluctuation of the VectorVest Composite price that is measured on a scale of 0 to 2.00. At a level of 1.01 LNTH is about average of all rated stocks. Therefore, this stock may not be suitable for the most conservative investors.
- Excellent Earnings Growth Rate (GRT): LNTH’s phenomenal 49% forecasted growth rate is measured over a forecasted three-year period. This fundamental factor is calculated in the VectorVest software, so you don’t have to do the work. A chart below highlights the up-trending earnings with an accelerating move since February 2021.
- Excellent VST Score: The VST Master Indicator ranks 9,164 stocks from high to low and brings to the top of the rankings those stocks with the highest VST scores. LNTH’s exceptional score is 1.39 which is the upper 10% of the entire database, quite an accomplishment. Using VST enables users to determine stocks that are performing much better than average, as well as the opportunity to find the cream of the crop in all its critical criteria with a few mouse clicks.
Considering the high VectorVest scores and explosive revenue growth, is this a safe time to buy LNTH, after it spurted 21% in two days. Or is it about to give back some of those recent gains, before its next move higher? Check out VectorVest’s ratings on this stock before making any move. To see the LNTH rating you can analyze it free using VectorVest to get the current recommendation.


Want These Types of Insights at Your Fingertips so You Can Win More Trades?
Use VectorVest to Analyze any stock free. VectorVest is the only stock analysis tool and portfolio management system that analyzes, ranks and graphs over 18,000 stocks each day for value, safety, and timing and gives a clear buy, sell or hold rating on every stock, every day.
Before you invest, check VectorVest! Click here to ANALYZE ANY STOCK FREE and see our system in action!


Leave A Comment