
Silvergate (SI) experienced an abysmal day of trading Thursday after announcing on Wednesday that its annual report is going to be delayed further than expected – after already announcing they’ll miss the deadline of March 16.
The bank has had as brutal a year as one can imagine, with shares falling an astounding 96% in the last year period. Over that span, the company has experienced nightmare scenarios with crypto firms like FTX that resulted in a ⅔ loss in deposits.
As a response, Silvergate was forced to let go of 40% of its workforce in January. The company has put a pause on dividend payouts for preferred shareholders. It’s clear the company is struggling to come up with cash – and many investors and analysts alike suspect this is the reason they’ve delayed their annual report.
And, Silvergate executives have admitted that shareholders should expect more severe losses than originally anticipated. That figure was somewhere around $887 million worth of non-interest losses at the start of the year – and there’s really no telling what it could be now. The bank is selling additional debt securities in an effort to come up with the capital to pay back outstanding advances and attempt to cut into these losses.
But, it’s not just current capital that Silvergate needs to be concerned with – it’s the continued threat of regulatory intervention. The bank has been linked to the highly-controversial FTX debacle – and regulators are still pressing the company to determine whether they were truly none the wiser to what FTX was doing with customer deposits.
It appears the writing is on the wall for Silvergate – and if you’re still holding shares of this company, you’re probably writing if this is your sign to cut losses on the stock. We’re going to take a look at the stock through the VectorVest stock analyzer software below to help you determine your next move.
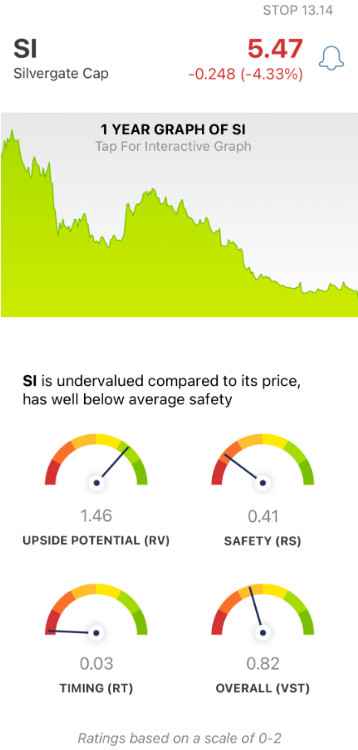
Despite Very Good Upside Potential, SI Has Very Poor Safety & Timing
The VectorVest system can help you save time in your trading strategy while eliminating costly errors. You’ll win more trades with less work - and it’s all thanks to the proprietary stock-rating system. With just three simple ratings, you’re given all the insights you need to make calculated decisions.
These ratings are relative value (RV), relative safety (RS), and relative timing (RT). They sit on a scale of 0.00-2.00 with 1.00 being the average. And based on these ratings, VectorVest provides you with a clear buy, sell, or hold recommendation for any stock you’re analyzing. As for SI, here’s the current scenario:
- Very Good Upside Potential: All the negatives aside, the upside potential for SI is still very good - as evidenced by the RV rating of 1.46. This is calculated by a deep comparison of the stock’s 3-year price appreciation potential to AAA corporate bond rates and risk.
- Very Poor Safety: As you can clearly see from reading any of the news surrounding SI, the company has very poor safety - and the RS rating of 0.41 reflects this. This rating is derived by analyzing the company’s financial consistency and predictability, debt-to-equity ratio, and business longevity - all of which leave much to be desired for SI.
- Very Poor Timing: Of course, the biggest issue for SI is the strong negative price trend the stock hasn’t been able to shake over the past year. This has resulted in an RT rating of 0.03 - which is about as poor as it gets. This rating is derived from the direction, dynamics, and magnitude of the stock’s price movement day over day, week over week, quarter over quarter, and year over year.
These three ratings contribute to an overall VST rating of 0.82 - which is poor. But is it officially time to cut losses - or is there any reason to hold out hope for SI? Get a clear answer on your next move by analyzing the stock free today. Don’t risk waiting any longer.


Want These Types of Insights at Your Fingertips so You Can Win More Trades?
Use VectorVest to Analyze any stock free. VectorVest is the only stock analysis tool and portfolio management system that analyzes, ranks and graphs over 18,000 stocks each day for value, safety, and timing and gives a clear buy, sell or hold rating on every stock, every day.
VectorVest advocates buying safe, undervalued stocks, rising in price. And while SI has very good upside potential, this is offset by very poor safety and even worse timing.
Before you invest, check VectorVest! Click here to ANALYZE ANY STOCK FREE and see our system in action!


Leave A Comment