LSI Industries Inc. (LYTS), founded in 1976 Cincinnati, Ohio, experienced a big price run-up on January 26, the day of their latest earnings call. The stock opened at $13.15 while closing at $14.98 the high for the day, an 11% sprint higher from the prior day’s close. This was the highest price compared to its all-time high of $23.05 way back on October 8, 2007.
LSI is a publicly traded stock on the NASDAQ Stock Exchange. They are a prominent U.S.-based manufacturer of non-residential display solutions and indoor/outdoor lighting. The company employs about 1,400 people at eleven manufacturing plants in the U.S. and Canada. The company manufactures commercial lighting solutions, advanced graphic and image solutions, and digital and retail display solutions. Its fiscal 2022 revenue hit $455 million. The company has a $400 million market-cap.
The Company’s strong presence in outdoor lighting applications coupled with an extensive portfolio of indoor lighting products provides LSI with the ability to provide its customers with unique solutions. Reported operating and net income was double the prior year’s quarter with reported diluted earnings per share of $0.22 and adjusted earnings per share of $0.26. Net sales were up 16% for the quarter ending December 31, 2022, with sales of $128.8 million. Net income was up a huge 107% to $6.4 million year over year. The next earnings release date is April 26, 2023.
The company continues to forge ahead and capture large competitive projects. For example, LSI completed a major solar installation for an oil retailer in Austin, Texas in mid-2022. They also won a project for one of the country's largest retail grocery chains that provides between 1,200 to 1,500 units of refrigerated and non-refrigerated display solutions.
Since the low stock price of $2.48 on March 25, 2019, LYTS has gained 481% vs. 43.7% for the S&P 500, quite a barn-burner performance, with a substantial part of that gain coming from the early August 15, 2022 period (140%) to now. The stock cleared its 40-day moving average on November 2, and hasn’t looked back since. And its Relative Timing (RT) since early November has placed it in the upper echelons of all the VectorVest stocks. LYST is ranked second in VectorVest’s building products sector out of 40 companies based on its VST rating (explained below). Moreover, LYTS sports an average daily trading volume of nearly 200,000 shares. And it pays a $0.20 annual dividend yielding 1.39%. The next Ex-Dividend date is Feb 3, 2023.
Excellent VectorVest Scores Are at Positive Going Forward...
The VectorVest ratings of LYTS are as follows:
- Very Good Upside Potential:The Relative Value (RV) rating focuses on a stock’s long-term, three-year price appreciation potential. The current RV rating for LYTS is 1.38 – nicely above the 1.00 level on a scale of 0.00-2.00. VectorVest’s current value of the stock is 15.01 compared to its current price of $14.40, therefore it is considered fairly valued, but with room to run on increasing volume.
- Fair Safety: The Relative Safety (RS) rating is based on the company’s business longevity, financial predictability/consistency, debt-to-equity ratio, and additional risk parameters, including price volatility. The RS rating of 0.94 is marginally below average, indicating more than average risk.
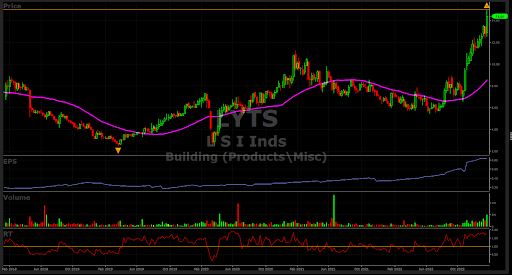
- Excellent Timing: The Relative Timing (RT) rating focuses on the price trend over the short, medium, and long term. The components include price direction, dynamics, and price magnitude of price changes over daily, weekly, quarterly, and yearly comparisons. LYTS has an exceedingly high RT rating of 1.74 As the accompanying chart shows, LYTS closed on Friday just below its recent multi-year high, and it is well above its 40-day moving average.
- Excellent Confort Idex: This index measures the consistency of a stock’s long-term resistance to severe and lengthy corrections. This index compares the individual stock to the fluctuation of the VectorVest Composite price that is measured on a scale of 0 to 2.00. At a level of 1.57, clearly, LYTS has an exceedingly higher-than-average rating. This high rating is a reassuring factor to conservative investors.
- Excellent Earnings Growth Rat (GRT): LYTS’s 29% forecasted growth rate is well above average and is measured over a forecasted three-year period. This fundamental factor is calculated in the VectorVest software so you don’t have to do the work. Its 5-year chart highlights the up-trending earnings since September 2019 with an accelerating move higher since September 2022, with forecasted earnings per share of $0.83 with an average P/E ratio of 17.35.
- Excellent VST Score: The VST Master Indicator ranks nearly 9,200 stocks from high to low and brings to the top of the rankings those stocks with the highest VST scores. LYTS’s score is 1.41 which is better than most stocks’ scores in this recovering bear market. Using VST enables users to determine stocks that are acting better than average, as well as the opportunity to find the cream of the crop with a few mouse clicks.
Considering all the excellent VectorVest scores, is this a safe time to buy LYTS, after its big 11% jump a few days ago, or is it about to consolidate before its next move higher? Check out VectorVest’s rating. To see the LYTS rating you can analyze LYTS free using VectorVest to get the recommendation.


Want These Types of Insights at Your Fingertips so You Can Win More Trades?
Use VectorVest to Analyze any stock free. VectorVest is the only stock analysis tool and portfolio management system that analyzes, ranks and graphs over 18,000 stocks each day for value, safety, and timing and gives a clear buy, sell or hold rating on every stock, every day.
Before you invest, check VectorVest! Click here to ANALYZE ANY STOCK FREE and see our system in action!


Leave A Comment