Can Steel Dynamics Reinforce Your Portfolio?
Steel Dynamics, Inc. (STLD) is a basic steel manufacturing and metal recycling company that is one of the largest domestic steel producers in the United States. Furthermore, the company manufactures liquid pig iron, as well as processes and sells ferrous and nonferrous scrap. STLD is the third largest carbon steel producer in the United States, with a capacity of 13 million tons. The company is based in Fort Wayne, Indiana and was founded in 1993. It has facilities throughout the United States and Mexico. It went public on the NASDAQ in 1996. Its market cap is nearly $20 billion and a P/E ratio of 4.90.
According to their press release dated December 15, 2022, “Based on the resilience of the company’s circular business model and continued confidence in its earnings outlook and cash flow generation, the company repurchased $338 million, or two percent, of its common stock during the fourth quarter through December 15, 2022.” This is a positive development, and it is one of the reasons why its stock price increased by 17% from $95 in early January to $111.52 on January 13. On December 13, it reached an all-time high of $112.73. Another factor driving the price increase was the company’s inclusion in the S&P 500 Index on December 19, 2022, replacing Abiomed Inc. It was previously a component of the S&P Midcap 400.
STLD is currently trading above the standard 40- and 200-day moving averages, which is a positive sign for the future trend. Furthermore, it has driven above its short-term 10- and 20-day moving averages over the last five days as its uptrend has accelerated. Breaking above the December high should propel it higher because there will be no overbought resistance. STLD is ranked third out of 17 stocks in its industry by the VectorVest VST rating, and sixth in its business sector (22 stocks). The average daily trading volume is 2.5 million shares, making it very liquid for traders and investors to take advantage of a narrow bid-ask spread.
STLD pays an above-average annual dividend of $1.36, yielding 1.22% at its current price. Furthermore, it has a Dividend Safety Rating of 99, the highest possible rating, indicating that future dividends are guaranteed. Mutual funds currently own approximately 56% of its outstanding shares. Furthermore, the fund managers have been purchasing its shares for the past eight quarters. Its annual sales are $22.75 billion, and its sales growth rate is a respectable 11% per year. The earnings report for the fourth quarter of 2022 is due on January 25, 2023. Profits per share for the quarter are expected to range between $3.34 and $3.38, according to consensus analyst estimates.
Therefore, interested investors should consider waiting for this report’s release before making any buying decisions, otherwise, if the earnings disappoint, the stock may fall a few percentage points or more. But based on its consistent earnings over the years that possibility is slim.
The VectorVest ratings of STLD are as follows:
- Very Good Upside Potential: The Relative Value (RV) rating focuses on a stock’s long-term, three-year price appreciation potential. The current RV rating for STLD is 1.33 – much above the 1.00 level on a scale of 0.00-2.00. VectorVest’s current value of the stock is $124.54 compared to its current price of $111.52, therefore it is considered undervalued.
- Excellent Safety: The Relative Safety (RS) rating is based on the company’s business longevity, financial predictability/consistency, debt-to-equity ratio, and additional risk parameters, including price volatility. The RS rating of 1.42 is well above average, indicating a minimal risk.
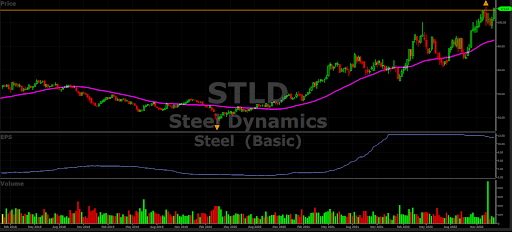
- Good Timing: The Relative Timing (RT) rating focuses on the price trend over the short, medium, and long-term. The components include price direction, dynamics, and price magnitude of price changes over daily, weekly, quarterly, and yearly comparisons. STLD has an above-average RT rating of 1.14. As the accompanying chart shows, STLD closed near its all-time high on December 13, 2022, of $112.73, and is also above its 40-day moving average during the past week.
- Very Good Earnings Growth Rate (GRT): STLD’s 15% forecasted growth rate is above average and is measured over a forecasted three-year period. This fundamental factor is calculated in the VectorVest software so you don’t have to do the work. Its 5-year chart highlights the up-trending earnings through December 2022, and then a leveling off of the earnings with forecasted earnings per share $11.63.
- Very Good VST Score: The VST Master Indicator ranks nearly 9,200 stocks from high to low and brings to the top of the rankings those stocks with the highest VST scores. STLD score is 1.29 which is better than most stocks’ score in this recovering bear market. Using VST enables users to determine stocks that are acting better than average, as well as the opportunity to find the cream of the crop with a few mouse clicks.
Considering all the VectorVest rating criteria, is this a good time to buy STLD, as it is only 1.1% away from its recent high, or is it about to take a dive and give back some of its recent gain? You may be surprised at the current VectorVest rating, knowing that only 34% of all the 9,153 stocks are currently rated a “Buy”. To see the STLD rating you can analyze STLD free using VectorVest to get the recommendation.


Want These Types of Insights at Your Fingertips so You Can Win More Trades?
Use VectorVest to Analyze any stock free. VectorVest is the only stock analysis tool and portfolio management system that analyzes, ranks and graphs over 18,000 stocks each day for value, safety, and timing and gives a clear buy, sell or hold rating on every stock, every day.
Before you invest, check VectorVest! Click here to ANALYZE ANY STOCK FREE and see our system in action!


Leave A Comment