
by Leslie N. Masonson, MBA
StoneCo Ltd (Nasdaq: STNE), was founded in 2000 in George Town, the Cayman Islands, where it is currently headquartered. The company offers financial technology and software applications to its 2.6 million customers and partners in the area of electronic commerce, and especially online, in-store and through mobile channels. Their clients comprise mostly small and mid-sized firms and e-commerce platforms. STNE had $998 million in annual sales and a market capitalization of $4.83 billion.
STNE Inc. is a mid-sized company that has landed at the #4 ranking in VectorVest’s Software (Business ) industry group out of 294 companies, as well as #7 in the broader Software Sector of 459 companies. Moreover, the Software (Business) sector is ranked only 169 out of 222 industry sectors tracked by VectorVest, which is in the lower 25% of the pack. So, the stock is outperforming its competitors by a wide margin, even though its industry performance is not highly ranked.
For its size and business lines, the company is popular among institutions as 378 hold 73.1% of their 281 million shares outstanding. Blackrock owns 6.6% of its shares, Berkshire Hathaway, Inc. owns 4.64%, and Point72 Asset Management, L.P. (owned by the well-known Steve Cohen) owns 3.5%. Interestingly, neither the This was cut off
This interest in the stock by so many institutions is a big plus, as those are the type of firms that can push the stock price higher as they buy more shares for their clients, mutual funds or ETFs. Currently, 11 analysts cover the company with seven rating the stock a “Strong Buy.” Zacks also ranks the stock a “Strong Buy.”
STNE’s Solid Metrics, Undervaluation, and Recent Price Action Indicate a Positive 2024
The VectorVest software issues buy, sell, or hold recommendations on 9,129 stocks. This proprietary stock rating system splits the data into three simple ratings: relative value (RV), relative safety (RS), and relative timing (RT). Each is measured on a scale of 0.00-2.00, with 1.00 being the average for quick and easy interpretation, and 2.00 being the best.
The VectorVest ratings for STNE are as follows:
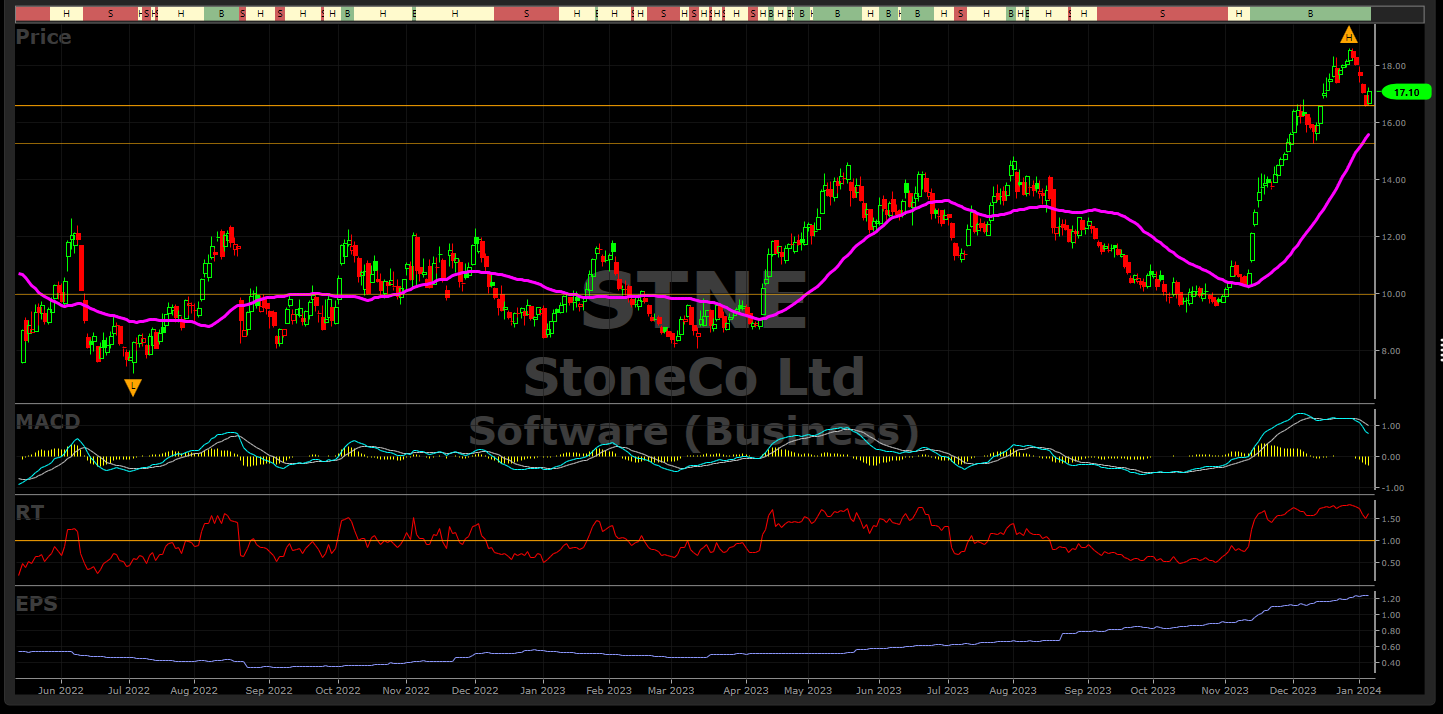
- Excellent Upside Potential: The Relative Value (RV) rating focuses on a stock’s long-term, three-year price appreciation potential. The current RV rating for STNE is 1.42, which is exceptionally high. Moreover, VectorVest determined that STNE is significantly undervalued with a calculated current value of $22.59. Therefore, the stock can move another 32.1% before reaching the value placed on it from its current price of $17.10.
- Fair Safety: The Relative Safety (RS) rating is based on the company’s business longevity, financial predictability/consistency, debt-to-equity ratio, and additional risk parameters, including price volatility. Its RS rating of 0.86 is above average, indicating above average risk. Therefore, long-term conservative investors would probably feel uncomfortable holding this stock.
- Excellent Timing: The Relative Timing (RT) rating focuses on the price trend over the short, medium, and long term. The components include price direction, dynamics, and price magnitude of price changes over daily, weekly, quarterly, and yearly comparisons. STNE has a well above average RT rating of 1.65 compared to the average 1.05 RT of all the stocks in the database.
- Very Good Comfort Index: This index measures the consistency of a stock’s long-term resistance to severe and lengthy corrections. This index compares the individual stock to the fluctuation of the VectorVest Composite price. With a CI rating of 1.34 STNE rating is well above average. Therefore, this is another positive metric indicating that it is suitable for long-term conservative investors.
- Excellent Earnings Growth Rate (GRT): STNE has annual sales of $998 million and a 28% forecasted growth rate. Moreover, its sales growth of 30% over the last year is also exceptional. These are just two of the important fundamentals that are calculated in the VectorVest software and available to users with a mouse click.
- Very Good VST Score: The VST Master Indicator ranks 9,130 stocks from high to low and brings to the top of the rankings those stocks with the highest VST scores. STNE’s score is 1.37 which is nicely above average. Using VST enables users to determine stocks that are performing much better than average, as well as the opportunity to find the cream of the crop with a few mouse clicks. STNE is not at the top of the VST scoreboard, but it is certainly in the top 2% of companies reviewed.
Overall, STNE is a mid-sized company with positive metrics, but its Return on Equity of only 7.6% is troublesome. Over the past week the MACD (see graph below) has turned negative and needs to turn up before any purchase is made. The stock price has had a great run since its October 16, 2023 low, advancing from $9.34 to a high of $18.61 on December 28, almost doubling, before falling 8% since then. This may be the dip that is the buying opportunity once the Daily Color Guard and MACD both turn bullish.
The average daily volume of 5.6 million shares is more than sufficient for a low bid-to-ask spread for investors and traders.
STNE’s shares surged nearly 80% since 12/30/22 in the year-to-date period, more than tripling the S&P 500’s return of 21%. The current stock price is 9.36% above its 40-day moving average, which is reasonable. The RSI (14) that is not shown on the chart is at a reasonable 56. That is considered mid-range with nothing to be concerned about.
The stock can accumulated, if it rises above its high of $18.81, as that is its current resistance level. Any near-term price decline below $15.28 would indicate there is possibly more downside indicating that investors should stay away. Currently, STNE is on a VectorVest ‘Buy” signal since November 10 which occurred before the 80% run-up. So caution is urged at this point until it takes out its recent high and the MACD has a positive crossover. VectorVest users can place STNE in a watchlist to determine when and if it should be bought.


Want These Types of Insights at Your Fingertips so You Can Win More Trades?
Use VectorVest to analyze any stock free. VectorVest is the only stock analysis tool and portfolio management system that analyzes, ranks and graphs over 18,000 stocks each day for value, safety, and timing and gives a clear buy, sell or hold rating on every stock, every day.
Before you invest, check VectorVest! Click here to ANALYZE ANY STOCK FREE and see our system in action!


Leave A Comment