
Protalix BioTherapeutics, Inc. (PLX: NYSE AMEX and Tel Aviv Stock Exchange) is headquartered in Carmiel, Israel with an office in Hackensack, NJ, with a total of 197 employees. Protalix Ltd. was incorporated in 1993. It became a U.S public company on December 31, 2006. PLX is a biopharmaceutical company that develops, produces and commercializes recombinant therapeutic proteins produced by its proprietary ProCellEx® plant cell-based protein expression system. This system has already earned the company a place in the history books as the first to gain U.S. Food and Drug Administration (FDA) approval of a protein produced through plant cell-based in suspension expression systems.
Protalix has its fingers in many pies, with business operations spanning the globe, including the United States, Australia, Canada, Israel, Brazil, Russia, and Turkey. The company has licensed to Pfizer Inc. the worldwide development and commercialization rights to Taliglucerase alfa, a significant milestone in its journey towards success. Its product pipeline is made up of proprietary versions of recombinant therapeutic proteins targeting the pharmaceutical industry.
According to a company press release: “The Company recorded revenues from selling goods of $25.3 million for the year ended December 31, 2022, an increase of $8.6 million, or 51%, compared to revenues of $16.7 million for the year ended December 31, 2021. Revenue from licenses and R&D services for the year ended December 31, 2022 were $22.3 million, an increase of $0.7 million, or 3%, compared to revenues of $21.6 million for the year ended December 31, 2021. A Net loss was reported for the year ended December 31, 2022 was approximately $14.9 million, or $0.31 per share, basic and diluted, compared to a net loss of $27.6 million, or $0.62 per share, basic and diluted, for the year ended December 31, 2021.”
But what about Protalix’s financials? PLX has a current market cap of $159 million and a low P/E ratio of 13.24, substantially lower than the average VectorVest stock, which boasts a P/E ratio of 48.39. Furthermore, the company has forecasted earnings per share of $0.21 for the year ahead, demonstrating potential for growth. There are 57.4 million common shares outstanding. Although only 30 institutions hold 12% of the shares, with Highbridge Capital Management Holding 2.4 million shares (4.2% of outstanding shares), and a number of well-known other hedge funds including Renaissance Technologies, LLC, Bridgeway Capital Management, Inc., and Citadel Advisors LLC holding less than 0.50% each, insiders hold only a 12% stake, not a resounding endorsement of the company’s future prospects. It should be noted that the company does not pay a dividend.
PLX is ranked #1 in the VectorVest universe of 866 Drug/Biomedical/Genetic stocks, as well as #2 out of 866 stocks in the general Drug sector, quite an accomplishment among many top-rated companies. With a very strong forecasted earnings growth rate of 41% over the next year and consistent year-over-year earnings growth, the company’s high rankings are well deserved. However, it is important to note that the Drug sector is ranked 37th out of 40 sectors on a Relative Timing (RT) measurement, indicating that it is in the bottom ten percent of the strongest trending sectors. This is not a good precursor of future performance when matched against all sectors. While this low ranking does not necessarily preclude individual stocks such as PLXInc. from rising in price based on their individual merits, investors should be wary of the potential risks.
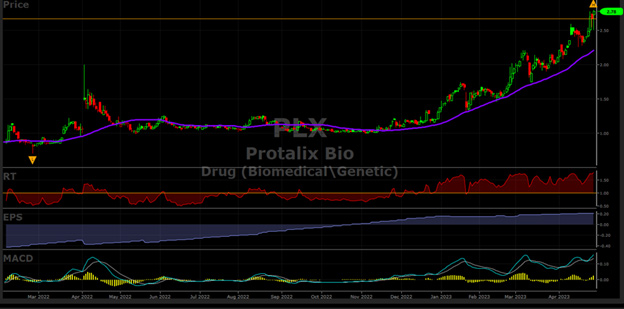
PLX’s stock price is currently 26% above its 40-day moving so, it is a bit stretched. However, over the past three days the MACD has crossed to the upside which is definitely a positive and the price has been in a steady uptrend bouncing off the 40-day moving average four times since November indicating that the uptrend remains intact. A key consideration is that this is a $2 stock so it is not every investor’s cup-of-tea and entails much more risk that a blue chip stock. Call and put options are available for the more intrepid traders. If you have never traded options or want to learn more consider one of VectorVest University seven options courses to enhance your knowledge.
PLX Has Superior VectorVest Scores, Is Undervalued, But Has 1.43 Beta Indicating High Volatility
Make sure to understand and review VectorVest’s PLX’s key metrics:
- Excellent Upside Potential: The Relative Value (RV) rating focuses on a stock’s long-term, three-year price appreciation potential. The current RV rating for PLX is 1.54 which is much higher than the average on a scale of 0.00-2.00. VectorVest’s current value of this stock is 3.82with a current price of 2.74; therefore it is undervalued which is a positive characteristic.
- Poor Safety: The Relative Safety (RS) rating is based on the company’s business longevity, financial predictability/consistency, debt-to-equity ratio, and additional risk parameters, including price volatility. Its RS rating of 0.81 is below average, indicating above average risk and volatility.
- Excellent Timing: The Relative Timing (RT) rating focuses on the price trend over the short, medium, and long term. The components include price direction, dynamics, and price magnitude of price changes over daily, weekly, quarterly, and yearly comparisons. PLX has a significantly high RT rating of 1.66compared to the average 0.86 RT of all the stocks in the database which means that the stock has been performing well above average for multiple timeframes.
- Fair Comfort Index: This index measures the consistency of a stock’s long-term resistance to severe and lengthy corrections. This index compares the individual stock to the fluctuation of the VectorVest Composite price that is measured on a scale of 0 to 2.00. At a level of 1.44 PLX’s rating is significantly above average. Therefore, this stock can be considered by conservative investors, by is more suited for aggressive risk-oriented investors.
- Excellent Earnings Growth Rate (GRT): PLX’s robust 41%forecasted growth rate is measured over a forecasted three-year period. This fundamental factor is calculated in the VectorVest software, so you don’t have to do the work. The chart below highlights the positive earnings trend.
- Excellent VST Score: The VST Master Indicator ranks 9,146 stocks from high to low and brings stocks with the highest VST scores to the top of the list. PLX’s exceptional above-average score is 1.40 Using VST enables users to identify stocks that are performing much better than average, as well as the opportunity to find the cream of the crop in all its critical criteria with a few mouse clicks. This stock is definitely in that category, but because of its volatility, stop orders should be placed as soon as the stock is purchased to avoid big losses.
Considering four “excellent” ratings on these metrics, this stock is one of the best rated in its universe. Therefore, think about inserting PLX into your watchlist for a potential buying opportunity after doing your due diligence, and only when the overall VectorVest stock market signal is “bullish” which it currently is not.
Remember that the company’s earnings release and conference call for the first quarter 2023 results will occur on Monday, May 1 at 8:30 am EST, so check it out before making a bet on this stock. This report, if positive, will likely cause an upward spurt in the price after the close on Monday. But as with any investment, it's important to exercise caution and be mindful of the broader market context.
Protalix BioTherapeutics, Inc. is a biopharmaceutical company on the rise, with a global presence, a strong product pipeline, and a promising financial outlook. It's one to carefully watch.
Determine whether VectorVest continues to rank this stock as a buy after the earnings release. Therefore, check out PLX’s recommendation on May 2. Analyze it for free using VectorVest.


Want These Types of Insights at Your Fingertips so You Can Win More Trades?
Use VectorVest to Analyze any stock free. VectorVest is the only stock analysis tool and portfolio management system that analyzes, ranks and graphs over 18,000 stocks each day for value, safety, and timing and gives a clear buy, sell or hold rating on every stock, every day.
Before you invest, check VectorVest! Click here to ANALYZE ANY STOCK FREE and see our system in action!


Leave A Comment