If you’re wondering what’s contributing to the volatility in the market, it’s more than just inflation data, geopolitical events, or tech domination; a macro impacter for the market is earnings season! With Home Depot reporting lower-than-expected numbers and investors waiting for Nvidia’s report pessimistically, earnings season is hitting the markets with a baseball bat. This time period comes with a unique level of unexpected drama and the potential for huge upswings and even bigger downturns, so let’s dive into what’s happening.
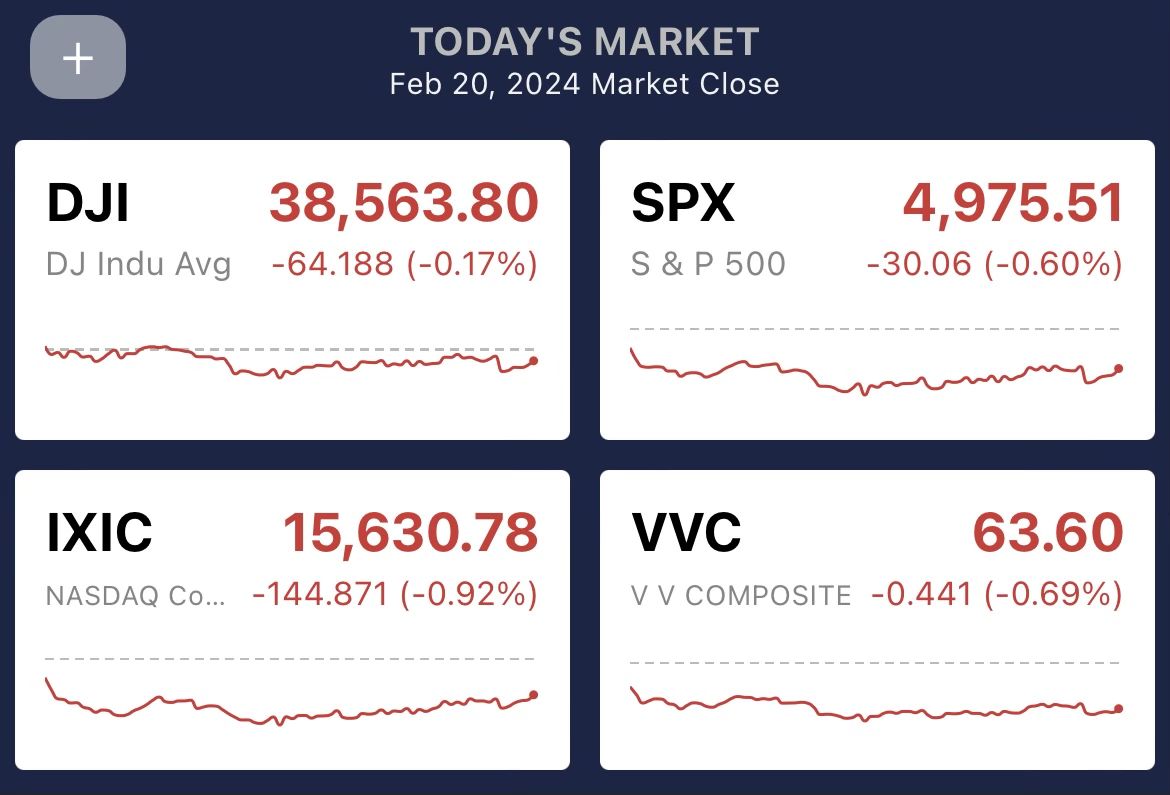
Yesterday, February 20th, the market closed in the negative with an evident amount of decliners, as shown on your VectorVest app, with leading impactors including Home Depot’s (HD) poor numbers and weak guidance, Westlake Corp (WLK) pain performance missing on estimates citing global macroeconomic conditions, and most notably, Palo Alto Networks (PANW) missing all quarter 3 estimates, cutting guidance, and dipping 24% pre-market because of the report.
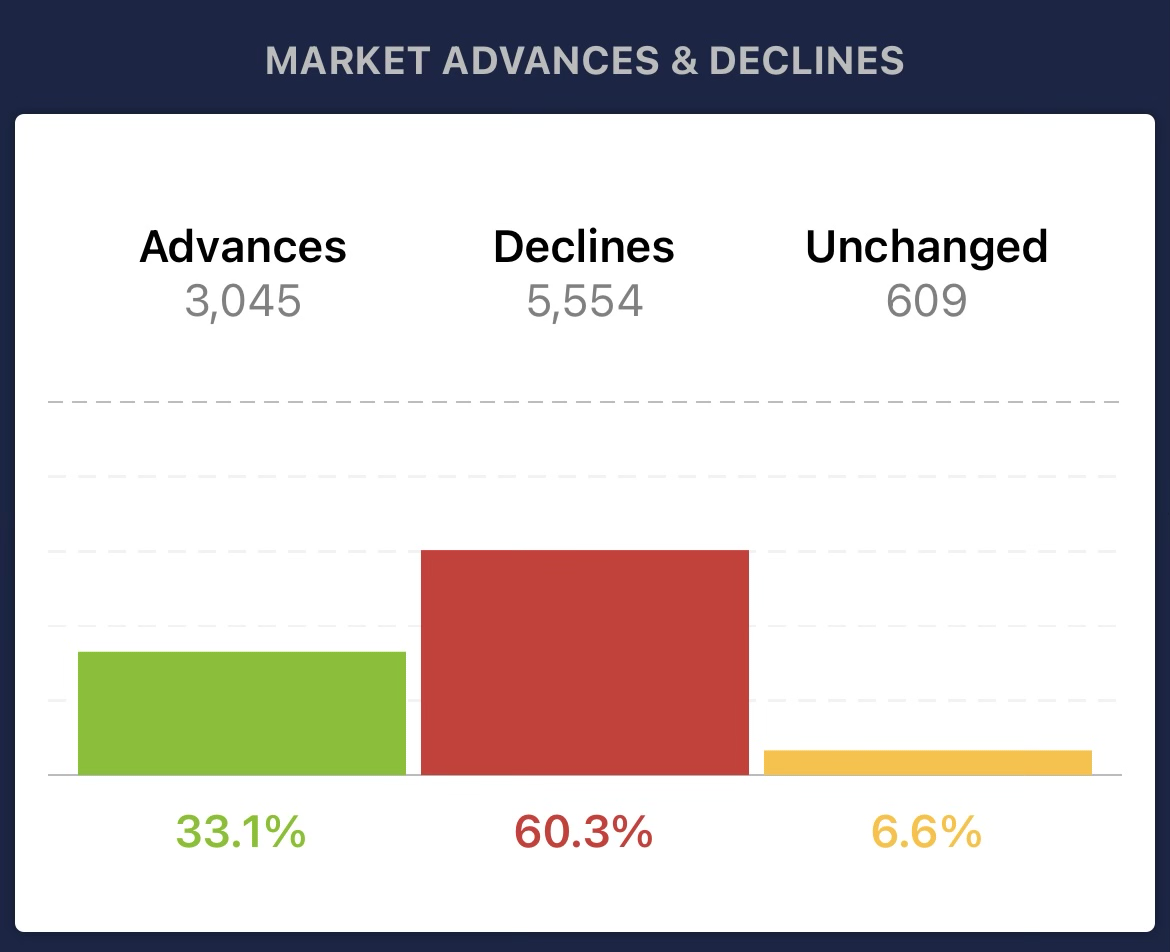
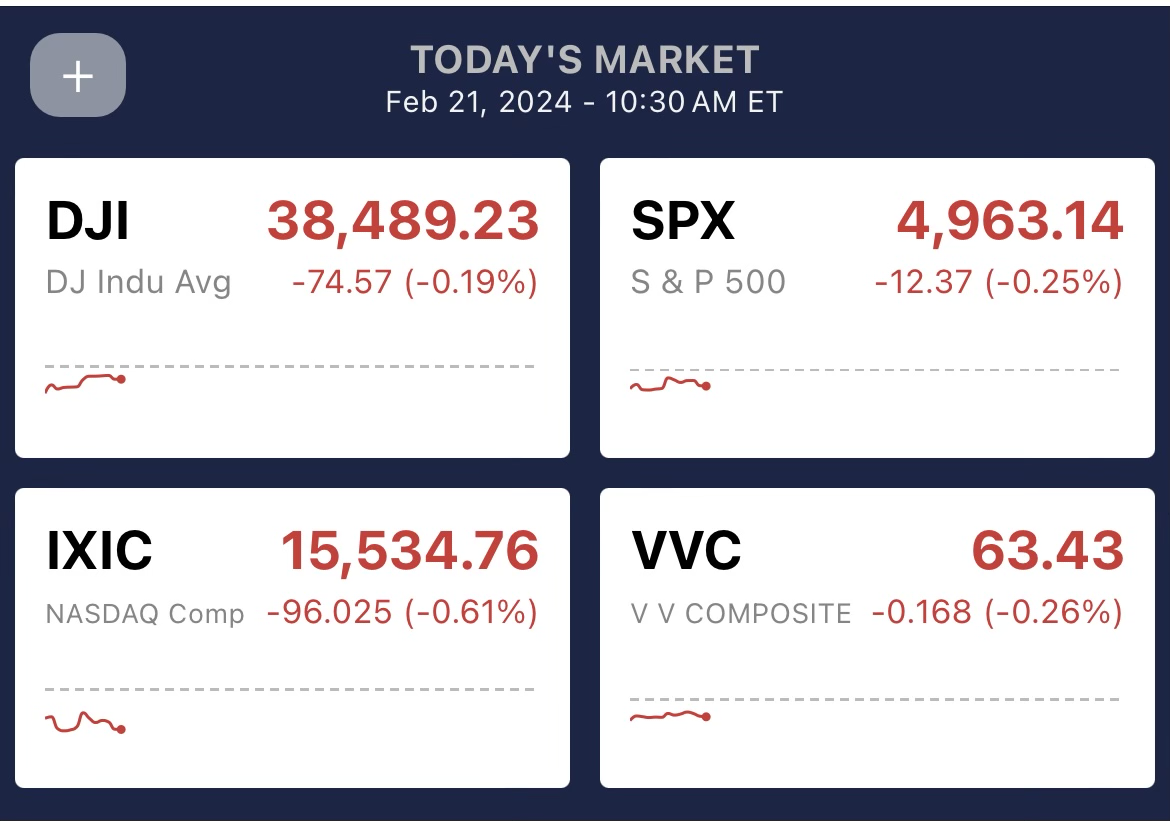
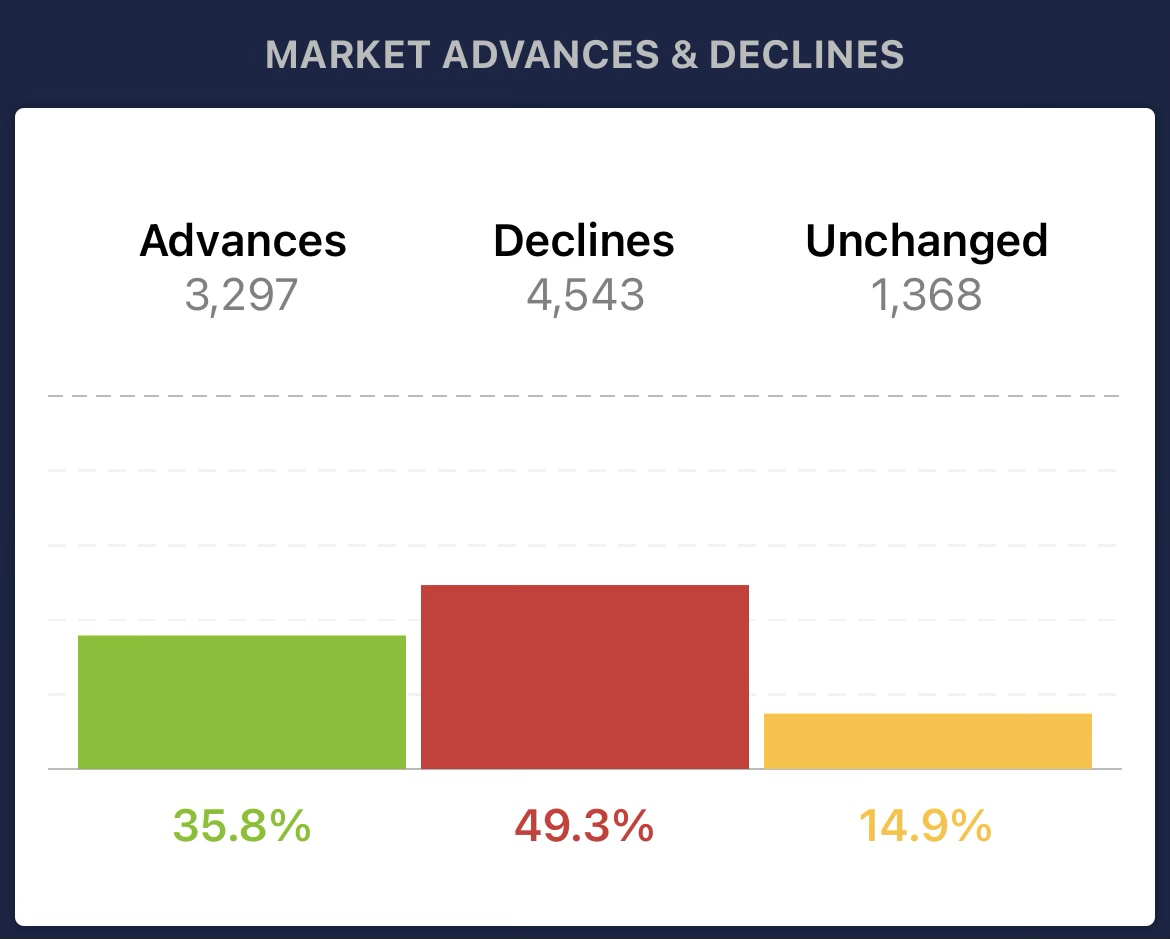
An hour into the trading session on February 21st, it’s visible that the market is still in the red, with decliners leading advancers by significant margins, as shown below. The reason? The market is rebounding following poor earnings, and the tech sector is fickle as it anticipates Nvidia’s earnings report tonight. Although there’s strength in the market, when tides turn negative, there must be a particularly hefty booster to turn the market positive. Earnings season has a macro impact on the market when things go right and even more so if they go wrong.
What exactly is earnings season?
Earnings season is a period of time when the truth comes out about a company’s financial state. It is also a crucial period for market participants because of the influence on stock performance. Companies release their quarterly financial metrics, and Analysts closely examine those metrics to determine a company’s financial health. The metrics include earnings per share (EPS), revenue, capital expenditures (Capex), earnings before interest, taxes, depreciation, and amortization (EBITDA), and more. These metrics provide insights into a company’s financial health and are often compared to analysts’ estimates on a quarterly and yearly basis, depending on the company’s size.
The truth comes out because a CEO might be able to say, “We’re doing better than anyone expected,” and the reality is the company is dipping in every margin. A company’s earnings numbers don’t lie or beat around the bush, and with the tumultuous year of 2023, the truth is coming out about companies’ performances, such as Home Depot, Westlake, and Palo Alto Networks. Analysts use the valuations provided through the reports instead of the flowery words of companies to decide on definitive action, and the actions recently have been to sell.
Following earnings reports, earnings calls come after. During this period, earnings calls are a key component, where company executives discuss financial performance, management changes, legal matters, and industry shifts. These calls are accessible to the public, either live or through recordings on corporate websites, and they provide investors with color regarding the potential for a future turnaround or the long-term guidance of a company.
Why do earnings reports impact the market?
Once you’ve read your reports and listened to earnings calls, multiply that by a few hundred companies daily; it drastically impacts the market’s performance when there’s a trend toward success or failure. Here are just a few reasons why earnings seasons impact the market’s performance;
- Financial Performance: Earnings season provides a comprehensive view of a company’s financial health to gauge how well a company is performing compared to expectations.
- Investor Expectations: When actual results deviate significantly from expectations, a significant turn in buying or selling can lead to substantial market reactions.
- Stock Valuation Adjustments: Earnings reports can influence the valuation of a company’s stock if the report is different than expected, it may lead to upward revisions, or disappointing earnings may prompt downward revisions.
- Market Sentiment: Earnings play a crucial role in shaping overall market sentiment. Strong earnings across various sectors can contribute to a bullish market sentiment, while widespread disappointments can lead to a more bearish outlook.
- Guidance and Forward-Looking Statements: Besides historical financials, companies often provide guidance or forward-looking statements during earnings calls. Positive or negative outlooks for future quarters can significantly impact investor confidence and influence market trends.
Overall, earnings season is crucial for investors to reassess their investment strategies, reallocate portfolios, and react to the latest financial information, contributing to significant movements in stock prices and market indices.
How VectorVest Helps!
It’s overwhelming to consider keeping up on every single stock like Home Depot or what might happen with Nvidia, especially if earnings calls are added to the equation, but with VectorVest, those metrics are handled for you. As the earnings season unfolds, the market is braced for a period of recalibration and guarded optimism.
Making informed investment decisions during earnings season demands staying ahead of key economic reports from major companies. Exploring VectorVest today could provide you with precise, actionable insights on navigating the market’s sentiment and the nuanced data of earnings season. VectorVest offers data-driven recommendations on potential investments and timing for buying or selling, serving as a critical tool for steering through the market’s volatility, especially during the earnings season, so you’re not stressed about staying on top of hundreds of companies.
Before you invest, check VectorVest! Click here to ANALYZE ANY STOCK FREE and see our system in action!


Want These Types of Insights at Your Fingertips so You Can Win More Trades?
Use VectorVest to analyze any stock free. VectorVest is the only stock analysis tool and portfolio management system that analyzes, ranks and graphs over 18,000 stocks each day for value, safety, and timing and gives a clear buy, sell or hold rating on every stock, every day.
Before you invest, check VectorVest! Click here to ANALYZE ANY STOCK FREE and see our system in action!


Leave A Comment