Get the look and feel of VV6 in VV7!
Click on image to enlarge.
VectorVest 7 has a cool, black look. It’s easy on the eyes and it looks sharp! But what if you want to print out a chart? You certainly don’t want to use all your printer’s ink! Or what if you just prefer the white look of VectorVest 6? Did you know you can change the look of your graphs? Here’s how:
How to Change a VectorVest 7 Graph to White
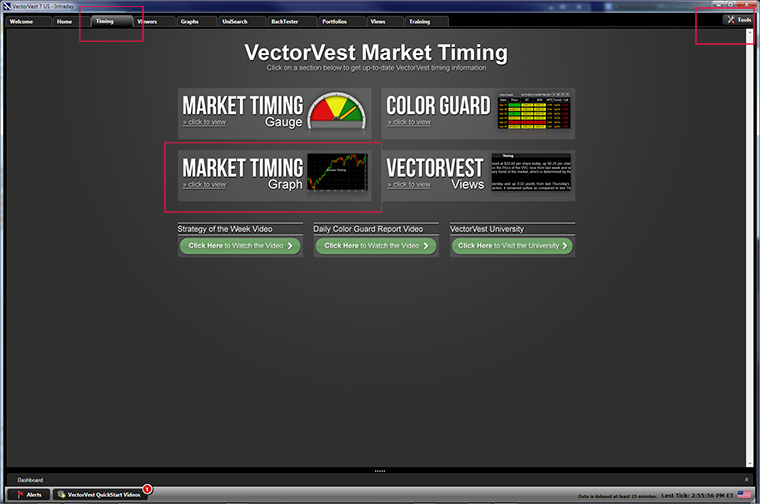
Where to find the Timing tab, the Market Timing graph and the Tools tab.
Click on image to enlarge.
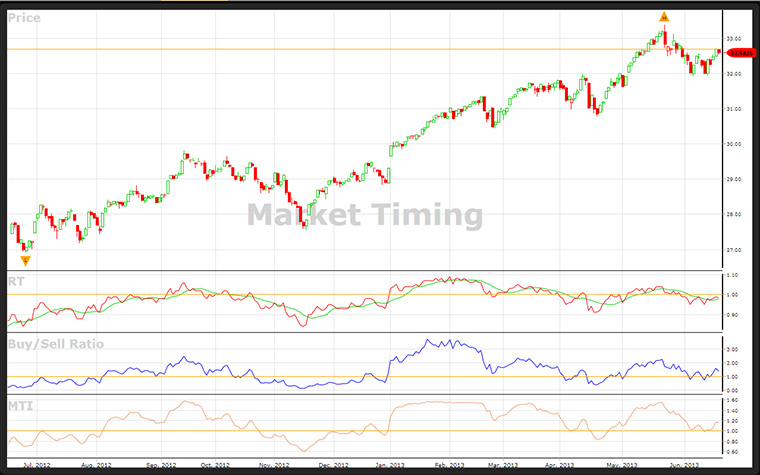
You have to do a little poking around but it really is easy to do. For this example, we are going to change the Market Timing graph from its default black to white. First things first, though. Let’s locate the Market Timing graph. Click on the Timing tab in the line of tabs that run across the top of the VectorVest 7 application. This will bring up the VectorVest Market Timing page. Click on the Market Timing Graph box (should be on the bottom left) to get to the Market Timing graph. This graph alone makes VectorVest worth every penny to the savvy investor! But that’s a story for another day. Let’s change some colors, shall we?
The Application Settings Window
Click on image to enlarge.
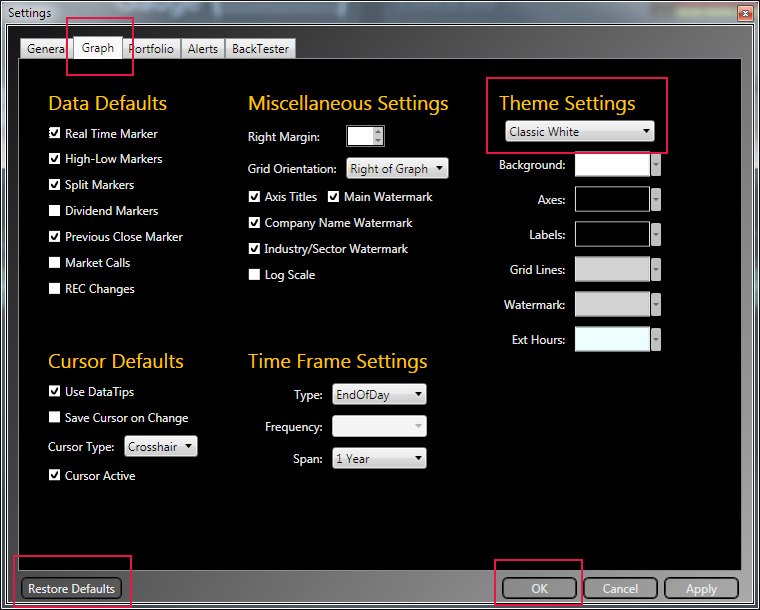
When you clicked on the Market Timing graph box, a new window opened up displaying the graph. To change the colors of the graph, you need to return to the main window (the VectorVest 7 application) and click on the Tools icon at the top right. A flyout menu will give you a list of options. You want to click on the bottom one: Application Settings. The Settings window is now showing. At the top of the window you will see a list of menu items. Click on the one labeled Graph. On the far right, you should see a list titled Theme Settings. The first pulldown button gives you three choices: VectorVest Black, Classic White, and Custom. Choose Classic White. You should notice that the list of options below have changed. Background should be white; Axes should be black; Labels should be black; Grid Lines should be gray; Watermark should be gray; and Ext Hours should be off-white. Click OK at the bottom and there you have it!
Customize Graphs to Your Heart’s Content!
No need to stop there, however! If you choose Custom instead of Classic White, notice that now Background, Axes, Labels, Grid Lines, Watermark, and Ext Hours have activated color pickers. You can click on any of them and play with colors until you get just the right look you want! Also, if you look at the Miscellaneous Settings, you can show/hide Axis Titles; the Main Watermark (in this case, the title “Market Timing” that appears on the graph); the Company Name Watermark; the Industry/Sector Watermark; and Log Scale. Furthermore, in the Data Defaults, you can adjust what appears by default on your graphs. Want a different look for your cursor? Then play with the settings in the Cursor Defaults list. The Time Frame Settings list allows you to change your graph time settings to update either by End of Day, End of Week, Weekly, or even Intraday. You can set the frequency of the Intraday setting, too. Once you have the settings the way you want them, click on the Apply button to see what your masterpiece looks like. If you’re not happy, play with the settings some more. If you do like what you see, click OK and they are set for you!
Oh oh. What happens if you messed something up and you don’t know what you did or how to fix it? No problem! Click the Restore Defaults button at the bottom of the Settings window and you’re back to VectorVest Black and all of the default settings. Now you know how to customize graphs in VectorVest 7!
Did you like this post? If so, share it with your friends, co-workers, and family using the links below. Also, if something isn’t clear, leave a comment and someone will answer your questions as quickly as possible. You can learn tips and tricks like these from the Two Day Investment Seminar video set, too!


How do I stop the moving market symbols? I need to see the market values of each company
Hi Ellis,
This is a gadget that can be easily removed. Please call our tech support at 1-888-658-7638 and they can walk you through it in no time!
The one thing you cannot do with VV7 graphing, but can do with Prographics is to create a log scale for price and establish the high and low limits to encompass the data string with the relationship that the high limit price is 10X the lower limit price. By graphing multiple stocks this way using Prographics and printing them with a PDF printer can can compare this apples to apples in terms of rate of return. For example, a simple compounded savings account present value would appear as a straight line rel to time with the slope of the line equal to the rate of return over the time period chosen. Volatility will also show up as a wide variation band about the line. Many stocks will show what appears to be a linear pattern when graphed this way. Safety margin bands can be drawn as lines parallel to the price line encompansing all the price data so that when the stock price trend changes so that new data falls outside the extended safety band, it is a clear indication that something has changed and perhaps a signal that the stock should either be accumulated for a higher rate of return or sold to cash.