 The VectorVest homepage is designed to read like the front page of your daily newspaper. However, the headline story is always the same: Market Timing.
How Does the VectorVest Homepage Help You Time the Market?
With a combination of graphs, training aids, gauges and strategies, the homepage of VectorVest 7 gives you insights into what the market is doing as a whole as well as how individual stocks, business sectors and industries are performing. And you can customize it to fit your portfolio, too. With the default homepage, you get a great deal of information to help you time the market.
The Default Homepage
Click on this image or any in this post to see an enlarged version. Click on your browser’s back button to come back to this post.
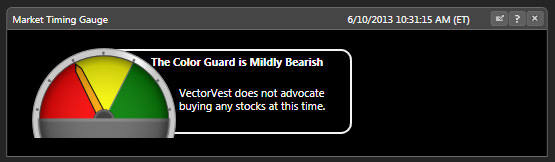
First, let’s look at the Market TIming Gauge. The Market Timing Gauge looks similar to a gauge you would find on the dashboard of your automobile. It’s divided into thirds: red on the left, yellow in the middle, and green on the right. These colors match those of the Color Guard where red indicates a Do Not Buy signal, yellow indicates a Proceed With Caution or Neutral signal, and green indicates a Buy signal. The needle will tell you where the market is, according to the VectorVest plan you have. For instance, if you have the End of Day plan, you’ll get signals from Market Close of the previous day; If you’re on the Intraday plan, you’ll get data that is delayed by 15 minutes; if you’re on the RealTime plan, you’ll get streaming data. The Market Timing Gauge will give precise instructions on what VectorVest recommends doing at that time. For instance, at the time of this post (Monday, June 10, 2013), the Color Guard is Mildly Bearish (right between the yellow and red fields), therefore VectorVest does not advocate buying stocks at this time.
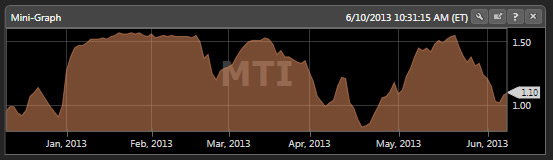 Another important market timing indicator is the MTI Mini-Graph. MTI stands for Market Timing Indicator. The MTI Mini-Graph shows you, especially if you’re a visual person, how the market is trending. If the market is trending downward, you should stay out of the market if you’re a prudent or cautious investor. If you’re an aggressive investor, you should be selling short on your trades. Wait for a clear upward trend before buying long. Don’t worry, VectorVest doesn’t leave the timing to guesswork on your part. VectorVest gives clear buy, hold and sell recommendations.
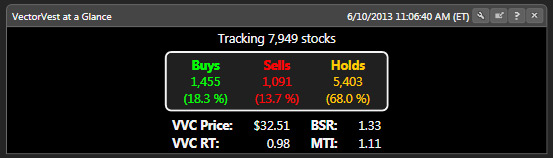 The VectorVest at a Glance graph shows the Buys, Holds and Sells of every stock VectorVest is tracking. (7,949 stocks at this time.) The Buy, Sell and Hold recommendations are based on the VVC (VectorVest Composite Index). The VVC is a mathematical formula the VectorVest system uses to evaluate stocks. You can find the actual formula here.
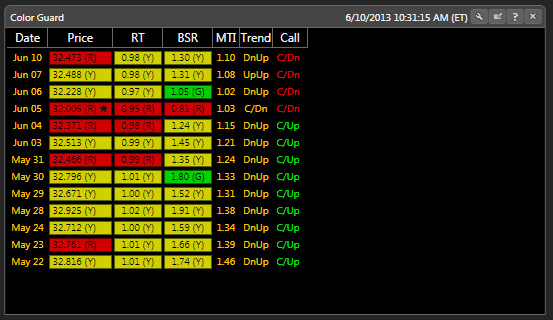 The Color Guard tracks Price; RT (Relative Timing); BSR (Buy to Sell Ratio); MTI; Trends and Calls with the red, yellow and green color indicators. You get clear Confirmed Ups and Downs to help you time the market. These directly correlate to the Market Timing Gauge. However, by seeing how Price, RT, and BSR are trending daily, you get a clearer picture of how the market is doing and why the market is trending the way it is. You won’t worry about a blip here and there. You’ll see when markets start to turn (either up or down) and you’ll also see when it’s time to sit back and enjoy the ride!
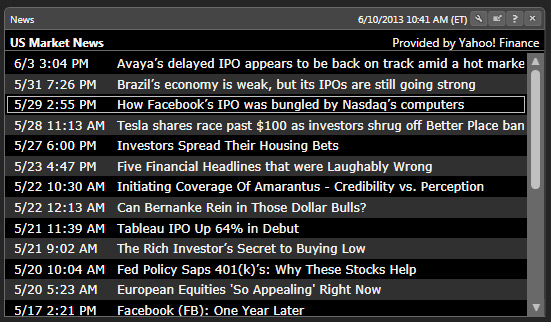 Going back to the newspaper analogy, your home page can also contain a News feed. Provided by Yahoo! Finance (the default, although you can choose Reuters or Financial Times if you would rather, by following this path: Tools>Application Settings>General>News Sources>Preferred News Source), these clickable news links can give you additional insight into what is happening in the market and what factors may be affecting it.
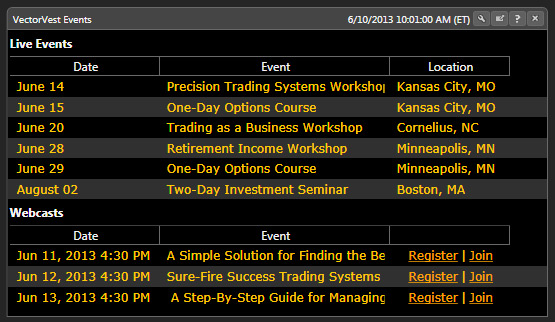 Just as newspapers have listings for events happening in your area, VectorVest has a listing of upcoming VectorVest Events that might interest you. The date, event, and location are provided. These are clickable links and take you to the corresponding page on our website where you can find out more information and sign-up, too.
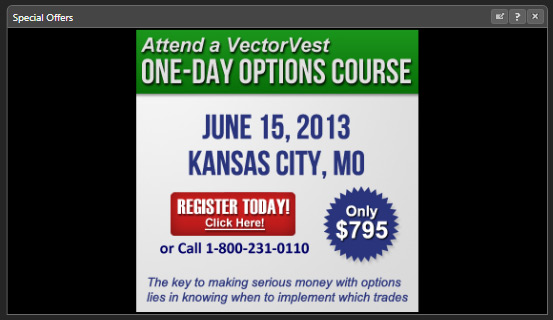 Newspapers have ads. Lots of them! If you so choose, you can populate your home page with Special Offers from VectorVest. (Don’t worry, it’s only one panel and won’t take up half the page or more like some newspaper ads!) These are great deals that we offer from time to time to help you better understand the VectorVest system and get more out of your software.
 We also offer a Training tab that is a link to the VectorVest University training videos. These training aids will help you get up to speed quickly with the VectorVest software. VectorVest, while easy to use, is very powerful. If you want to fully understand the functionality, you will love these easy to follow along training sessions. Along those same lines, VectorVest has the Strategy video. Updated daily, this video gives you a rundown on the market and how VectorVest recommends playing it. You are offered a choice of whether to watch the video or read the text. If you have a slower computer, bad connection or you’re short on time, the text option can come in quite handy.
The default homepage offers a few other goodies, too. For example, the Top VST Stocks (the top stocks that meet the criteria of the VectorVest Composite). VectorVest also offers industry and sector specific tabs: e.g., the Top RT Industries and the Top RT Sectors. There is also a QuickList, which compares the major indices (Dow Jones, NASDAQ, S&P 500 and 100) to the VectorVest Composite.
Customized tabs
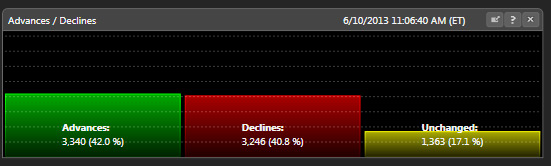 There are other features you may wish to add to your homepage, too. For example, you may want to see market Advances and Declines. to add a tab, click on the wrench in the home tab at the top of the page, then click on any of the icons that appear in the drop down ribbon. The new tab will now appear in your homepage. You may need to scroll down to see it. You can rearrange your home page by dragging tabs by their title bars.
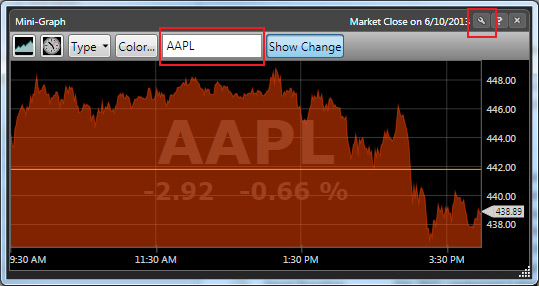 You can track individual stocks of your choosing with mini-graphs, too. Simply click on the wrench icon on the Home tab, locate a mini-graph from the drop-down ribbon and click on the icon to add to the home page. Next, click on the wrench icon of the mini-graph you just added to show its options. There should be a white field in the center. Click on this and type the stock symbol. If you don’t know the stock symbol, type in the name of the company and VectorVest will find it for you! Now you can see whether or not your stock is trending up, down or sideways. You can set for different time periods, too. For instance, you can see how your stock performed that day, for that week, for the month, for three months or for for three years! In short, you can tell VectorVest what time period you want to observe and it populates the graph for you.
As you can see, the VectorVest homepage can be as complete or as customized as you want it to be. Is there a tab that you don’t want any more? Click on the X in the toolbar and poof! It’s gone! Want it back or want to add something in its place? Click on the wrench in the Home tab, find what you are looking for in the pull down, then click to add to your home page. It’s that simple and easy! Want the default home page back? Click on Tools at the top of the page, then follow this path: Tools>Application Settings>General>Data Tools>Restore Homepage Layout. Now go and customize your home page the way it works best for you!
Did you find this post informative? Share it with your friends and colleagues by using the share buttons below. Feel free to leave any comments if you have questions, too.
Want to learn this subject in-depth? The Executive Premier Workshop covers this subject and more before the first break of the first day! (It’s a two-day workshop.)


Dear VV,
I will try you $9.95 Trial…I think your VV7 is a nice idea/service from what I can see on the surface.
I read that VV can get you out of the market when it begins its turn downward. But can VV direct its subscribers into ETFs that short the market/Sectors?
I’m not a fan of shorting individual stocks because of the risk of infinite losses, potentially, but would like to use Short/Ultra Short ETF vehicles.
Thanks much and look forward to perusing your VV7 service.
Tony
Tony,
Yes, indeed VectorVest 7 can use ETFs that short the market/sectors! You should contact our Tech Support at 1-888-658-7638 and someone can walk you through how to do it. (It’s not hard once you know how). Also, our Executive Premiere Workshops go into great detail about such strategies. Check our Events page to see if one is scheduled near you.
Thanks for the quick reply!
I downloaded the app for iPad but can’t figure out how to enter a stock symbol correctly. I put GRPN in and groupon but get errors.
Hi Paul,
If you’re having trouble with the app, call our customer support and they should have you up and running in no time!
1-888-658-7638 M-F 7am – 1am ET; 9am – 5pm ET Sat