 Want to know the absolute best way to make money in stocks? (Or shares, for our friends across the pond and down under.) The key to making money in the market lies in mastering the fine art of buying low and selling high. Yep. That’s it in a nutshell! However, as anyone who has ever traded in the market knows, it’s a lot easier said than done. That is, unless you use VectorVest!
How does one know when a stock’s price is low?
For those in the US, have you ever watched the squawking heads go on and on about buying stocks as they are going down in price? One personality in particular screams that so-and-so stock is going down in price so now is the time to jump in and buy! The problem with that strategy, if that is what you want to call it, is that you could be buying a stock at the beginning of its downward trend. As Newton’s First Law of Motion states, “an object in motion remains in motion unless acted upon by an outside force.” In other words, if a stock is going down, what’s to keep it from going down? Do you really want to hang on to a stock through what could amount to months and months of bad times just to finally feel vindicated months–or perhaps years–later?
So, when is the time to buy a stock at a low price? You wait until it has stopped going down and started going up. Plain and simple. And you don’t do it right away. You make sure the stock is well on its way up and then you jump on and enjoy the ride.
In order to do this properly, you need to know some fundamentals regarding the stock. You want to know its Relative Value (RV) and Relative Safety (RS). Fundamental investors–those who practice a buy and hold strategy–buy when they see attractive situations.
The value of a stock will rise when
- earnings go up
- inflation goes down
- and interest rates go down
Safety improves with
- outstanding financial performance
- consistent, predictable earnings growth
- above average earnings growth
- steady increases in stock price
- low debt/equity ratio
- high sales volume
Technical Investors–who are short-term traders–time their purchases to when they see evidence of rising prices.
Key indicators of rising prices
- price breakouts
- upward trending MAs (Moving Averages)
- new highs on increasing volume
- a rising market
Important: Market Direction is the single most important factor affecting a stock’s price movement! And the VectorVest Market Timing Graph clearly shows when the market is Rising, Falling, or even Transitioning. The MTI (Market Timing Indicator) graph gives explicit C/Up (Confirmed Up) and C/Dn (Confirmed Down) signals. Furthermore, the Color Guard tells you when it’s OK to buy stocks.
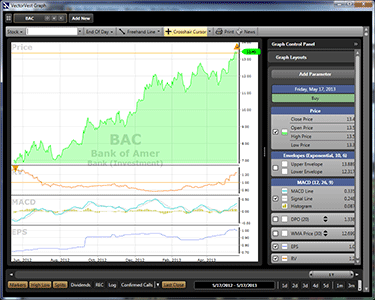
BAC (Bank of America) came from our Blue Chip Bargains–High AvgVol Bottom Fishing Strategy.
Look at that upward trend!
VectorVest also supplies you with strategies you can use for catching stocks on the rise. Under the Unisearch tab, you’ll find a folder called Bottom Fishing searches. Bottom-Fishing is the essence of buying low and selling high! Essentially, these are beaten up, under-valued stocks that have hit bottom and are now recovering. Bottom-fishing strategies work very well after a lengthy downturn.
You don’t need to just wait for downturns to correct themselves, though. Once a rally has continued for 4-6 weeks, it’s fine to begin using momentum searches, e.g., Explosive EPS Stocks II; High VST Newcomers; or Best Stocks Under $20. By switching to stocks in these strategic groups, you can hedge your portfolio to current market trends and continue to make profits (and cut losses).
When do you sell a stock?
Unless you’re a stubborn buy and hold investor, you don’t want to hold on to a stock forever. VectorVest gives clear, unmistakable recommendations on when to sell. You want to sell a stock after it begins to trend downward. The software will tell you if it is time to sell so you don’t exit too early or too late, thus protecting your portfolio from having one or two stocks that take away all the gains from your winning picks.
If you follow along with the Strategies of the Week, each Friday at market close you will get recommendations on what strategies are trending most effectively. If there are any losers in your portfolio, you can replace them with our recommended stocks and cut your losses significantly.
Can VectorVest “predict” absolute troughs and peaks? No. Investing is like the weather in that sense. You can mathematically predict trends, but you cannot foresee the future. So, with VectorVest, you don’t get in the instant that stocks begin their magical rise. Nor do you exit the second they begin to plummet. However, you do get in when they are trending upwards and you do get out when market indicators are negative and the stock is trending downwards. You have assured yourself of a healthy profit, or if you get in at the wrong time, not so much of a loss. By trading this way, you are stair-stepping your way to success!
Want to see our recommended picks and Strategy of the Week? Then start a risk-free, 5-week trial of VectorVest! Put the software through its paces for 5 weeks. Check the strategies and recommendations. Once you see how easy it is to make money on your investments, you’ll wonder why it took you so long to subscribe!


hi i want to play these markets how do i start
hi my name is brenda
i want to start trading in jsc and shares as well as in shares and COMMODITIES.
how do i start? how much money do i need to have to start? and how often do i put money?
there are lot of scams out there how do i know if this company vectorvest is the legitimate one.
is there trading code and where do i confirm its true before i put my money on the table.
thjank you
brenda
Hi Brenda,
Your questions regarding commodities might be a bit too involved to answer in this blog post, but we do have technical support who are trained to answer just such questions. Of course, you do need to be a subscriber. I can answer if VectorVest is a legitimate company or not, though. VectorVest has been in business for 25 years and has been scrutinized by the Better Business Bureau (has an A+ rating) and securities and trade organizations and has passed them all. We operate in 9 countries and our software comes in different versions for those specific countries/regions. We also encourage you to paper trade first so you can see how accurate the graphs and strategies are. You can start a 5-week trial for only $9.95, too! Hope this helps answer some of your concerns.
Aloha:
What is involved in buying stocks e.g. Bakken Oil, FMCC, COYR,NORX, SRBL. Can I buy them on-line or do I have to see a broker?
Aloha:
Howdo I buy the followinig stocks FMCC COYR, SRBL, NORX/ Please tell me the procedure. Thank you.
Consider investing in stocks that pay dividends. That way, even if the
stock declines a bit in value, you are receiving dividends that
can offset some of the losses. And if the
stock price rises, the dividends are a bonus that add directly to your bottom line.
They can also provide you with a periodic income.
What is the best way to swing trade options with your indicators?
Charles,
There is video on Options in the VectorVest University area. You can access it from the VectorVest software itself (not this website). Although it’s showing some age, the video still has valid info for using VV and options.
Also, we offer a great One-Day Options course! It always gets rave reviews from attendees. Check the Events page on our website to find when the next one takes place:
https://www.vectorvest.com/events/events.aspx
How much does the vector vest cost? Not the trial price special? after the 5 wk trial for $9.95.
Is it a annual subscription fee? Or do one buy the program?
Henry,
Because VectorVest gets streaming data from different sources, it is an annual subscription-based service. The price depends on whether you get real-time, intraday or any of the add-ons. You can call our customer service toll-free and they can help you more with your question: 1-888-658-7638, M-F 24 hrs/day, Sat 9-5 ET.
Hi,
I am in South Africa. How much does the annual subscription cost here in SA?
Will I get access to all the bourses in the world? I am also lokig at Australia and India.
Thanks.
Hi Jeeva,
I would suggest calling the toll-free number at 0 800 981 891 to get the answers you need. If we are running a special, they can help you with that, too! The toll-free lines are open 24 hours a day M-F and on Saturdays from 16:00-Midnight SAST.
Hi, I noticed a penny counter has been trading between $0.002 and $0.003 for a very long time. My question is, if I were to buy 100,000 stocks at $0.002 will I be able to sell it when it goes up to $0.003? If yes, who is willing to buy at $0.003?
Thanks
Just what honestly moved u to post “Secrets of Buying
Low and Selling High | VectorVestVectorVest”? I actuallyseriously liked it!
Many thanks -Justine
hi, i would that to find out from u that if i try fr the 5 wk trial at $9.95 n after it hv expire, do i need to subscript again or i will automaticaly being charge for $60 USD monthly? furthermore i would like to kw that if i call up the toll free line is there any international call charges? im from singapore. Thanks..
Hi Thomas,
If you try the 5 week trial, after it is over your subscription does go to the regular rate. We do have a Singapore toll-free line: 800-130-1519. There are no charges for calling this line and the help you get is second to none!
Have fun with your trial,
Keith
how about indian market your software suits