Tuesday was record-breaking for the major dip due to key inflation data showing consumers are hurting over price increases. After Monday’s record-breaking numbers because of tech stocks and positive earnings, it was a surprise to find the market again in bear territory. The dip came because January CPI was reported M/M at 0.3% vs. the 0.2% estimation, demonstrating a 0.3% rise in price increases that was not expected. In fact, the January CPI data came in so hot it may cause the Fed to pause on rate cuts for the first half of the year and could potentially disrupt the hopes for the economy’s soft landing.
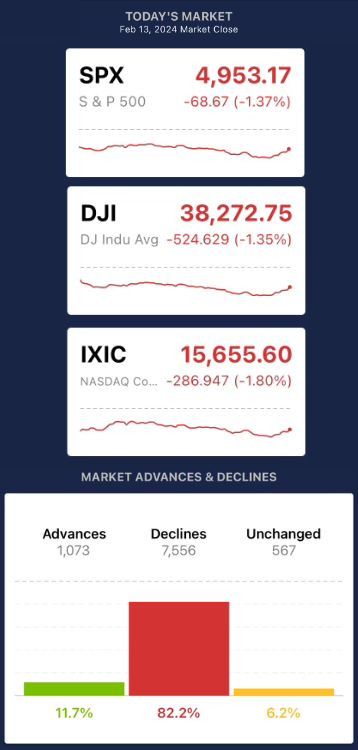
Finance fanatics have been worn thin pushing for a bull market, and the market clearly didn’t like the recent data moving nearly everything into the red. The Dow Jones Industrial Average plummeted by 525 points (1.4%), marking its most substantial single-day decline since March 2023. The S&P 500 and Nasdaq Composite also saw declines of 1.4% and approximately 1.8%, respectively. Looking at your VectorVest app, you can visualize the market’s overall movement, and on Feb 13th, it showed how the market felt. Not only were the indexes down, but taking a peak at the lead of declines versus advancers, it shows the unusual side of dominating decliners at an alarming rate.
Inflation data seems impossible to reconcile because how can the numbers be so close to Fed Chair Powell’s 2% goal but then send the whole market into a tissy the next day? Let’s dive into what the CPI data really means and how it impacts the Fed’s future actions.
What does the Consumer Price Index (CPI) data mean?
Essentially, the CPI data showed that prices were growing faster than economists expected. The Consumer Price Index (CPI) measures monthly changes in prices paid by U.S. consumers for goods and services. It is calculated by the Bureau of Labor Statistics (BLS), and CPI represents a weighted average of prices, reflecting the spending patterns of the aggregate U.S. consumer base; because of what it calculates, CPI is then widely utilized for assessing inflation and deflation.
The CPI covers 93% of the U.S. population and is based on approximately 80,000 monthly price quotes collected from 23,000 retail and service establishments and data from 50,000 rental housing units. Housing rents play a significant role in the CPI, estimating changes in shelter costs, including owner-occupied housing, indicating soaring housing prices will heavily impact the movement of CPI. The index also incorporates an owners’ equivalent category, capturing the rent equivalent for owner-occupied housing and adjusting for user fees and sales taxes, excluding income taxes and investment prices. These intensive factors culminate in why the CPI data is closely followed as a key metric for understanding economic trends.
Yesterday’s data communicated that used cars and clothes saw price drops; however, overall inflation rose due to soaring housing costs. Food prices also climbed, with groceries exceeding previous increases and dining out spiking 5.1% y/y. Beyond rising prices, consumers face “shrinkflation,” where brands maintain “regular prices” but reduce product size, so clearly, the pressures of inflation are still keeping the data hot, regardless of what the market wants.
How does the Fed use CPI data?
You and I might use CPI to assess inflation trends and the market’s reaction, while the Federal Reserve relies on it to adjust monetary policy. The Fed’s current goal is 2%, with the hope of cutting in June, but the data put a damper on the potential for that happening. Fed Governor Goolsbee said today in a speech, “The CPI data yesterday meant the puzzle got bigger, and it is something I am watching…Inflation may get a bit higher and still stay on track to 2%.” This is good news to stay on track, but it dashed investors’ hope of a rate cut in June. Additionally, businesses use CPI to make informed economic decisions, which could lead to continued price hikes and “shrinkflation” from businesses across the board.
How VectorVest Helps Investors Navigate CPI Data
Following January’s CPI report, which revealed mixed signals with rising housing costs but declining used car and apparel prices, the market will likely undergo a period of adjustment and cautious optimism. Investors will closely monitor future Federal Reserve communications, particularly regarding interest rate policies and economic indicators. This may lead to some volatility and shifts in sentiment as the market digests this new information.
For informed investment decisions, staying updated on Fed announcements and economic reports remains crucial, and trying out VectorVest today can give you a clear, definitive answer on maneuvering market sentiment and hot January data. VectorVest helps navigate inflationary fluctuations by offering data-driven recommendations on potential investments and buy timing while also keeping a thumb on the movements of the overall market.
Before you invest, check VectorVest! Click here to ANALYZE ANY STOCK FREE and see our system in action!


Want These Types of Insights at Your Fingertips so You Can Win More Trades?
Use VectorVest to analyze any stock free. VectorVest is the only stock analysis tool and portfolio management system that analyzes, ranks and graphs over 18,000 stocks each day for value, safety, and timing and gives a clear buy, sell or hold rating on every stock, every day.
Before you invest, check VectorVest! Click here to ANALYZE ANY STOCK FREE and see our system in action!


Leave A Comment