
The week started off weak, turning green, and then shifted to mixed due to disappointing data, biotech success, uncertainty in tech, and tension in the US steel market. Monday showed mixed market results, Tuesday was in the green, investors proved unbothered on Wednesday after unfavorable CPI data, and the rest of the week looks like a downslide as hot inflation data continues to be reported. CPI data is what really hit the market this week when last month’s consumer prices rose to 3.2% vs. the 3.1% expectation. Let’s jump into the market’s recent behavior, the impact of the CPI data, and why the market’s reaction was mixed.
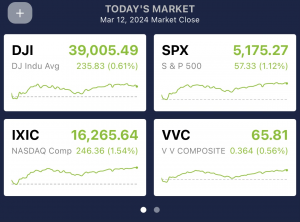
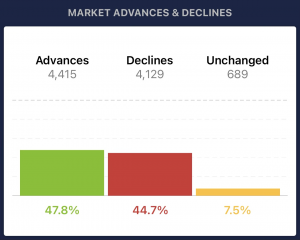
The closing on Tuesday, March 12th, after the less-than-thrilling CPI data, was actually in the green. The Dow was up 235 basis points (+0.61%), while the S&P 500 was up 57 basis points (+1.12%), showing undeterred market sentiment while advancers maintained a slight gain on decliners while showing a nearly flat market for buyers and sellers.
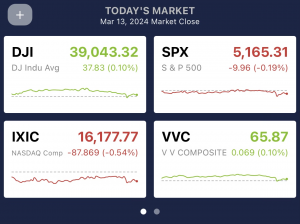
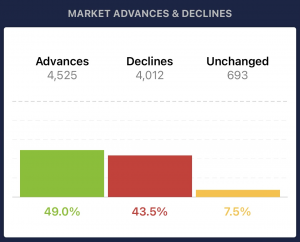
The following day, Wednesday, March 13th, the Dow closed in the green, up 37 basis points (+0.10), but the S&P 500 closed in the red, down 8 basis points (-0.19%). Advancers led decliners by a slightly larger margin than the day before but without a major shift.
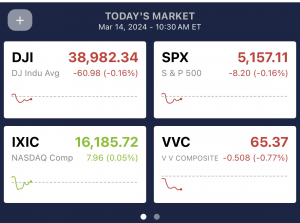
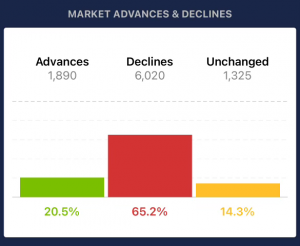
One hour into today’s trading session, Thursday, March 14th, a clear decline can be visualized through the VectorVest app, with the Dow down 60 basis points (-0.26%) and the S&P 500 down 8 basis points (-0.16%). Decliners overtook advancers by a significant margin, indicating that “sell” is the theme for the day.
What is CPI data?
It’s easy to look over metrics when you’re not sure where they come from and to understand CPI data, you need to know it is curated by the Bureau of Labor Statistics (BLS). The BLS gathers around 80,000 prices monthly from over 23K retail and service establishments to get a far-reaching hand to determine inflationary developments.
CPI is a widely used and followed metric to determine market developments. In the calculation of the CPI indexes, factors such as substitution effects are taken into account. Basically, it measures when consumers' behaviors change in reaction to certain products or categories that become more expensive. Additionally, price data is adjusted to accommodate product quality and feature changes. The weighting of product and service categories in the CPI indexes aligns with recent consumer spending patterns obtained from a separate survey.
If any and all of that went over your head, the CPI index uses extensive data collection from thousands of establishments, measures inflationary trends, and cost-of-living adjustments. It covers various expenditure categories, focusing on shelter costs, and incorporates factors like substitution effects and quality adjustments to represent consumer spending patterns accurately.
Why did the market have a mixed reaction to the CPI data?
The market did not react as strongly to the negative inflation data as investors expected, but it didn’t rebound. The report wasn’t too far off from the expectations while still disappointing, and the Federal Reserve’s influence plays a big role in how the market responds. Here’s why the market wasn’t heavily swayed;
- It was the 2nd reacceleration of inflation since December 2023, so it wasn’t a complete shock that it came in higher than analysts wanted.
- The Federal Reserve predominantly focuses on PCE data when considering rate cuts, not CPI data. Meaning it has less of an impact on what investors can anticipate happening on the market from the Fed while still being an overall metric used to gauge the economy's progress.
- The data supports the Fed’s current position to wait for more cooling before cutting rates in June, meaning it’s in line with Fed expectations and isn’t changing the Central Bank’s trajectory anyway.
Uncertain Times Call for Informed Methods
With the rising rates of inflation occurring before rate cuts, the market is feeling burnt out over the data coming in. Staying informed about movements is the first step to finding success surrounding uncertainty, and VectorVest offers a solution in this complex landscape by efficiently handling metrics, providing precise insights, and offering data-driven recommendations.
VectorVest data-driven recommendations on potential investments and strategic timing provide investors with tools for a stress-free investment approach.
Before you invest, check VectorVest! Click here to ANALYZE ANY STOCK FREE and see our system in action!


Want These Types of Insights at Your Fingertips so You Can Win More Trades?
Use VectorVest to Analyze any stock free. VectorVest is the only stock analysis tool and portfolio management system that analyzes, ranks and graphs over 18,000 stocks each day for value, safety, and timing and gives a clear buy, sell or hold rating on every stock, every day.
Before you invest, check VectorVest! Click here to ANALYZE ANY STOCK FREE and see our system in action.


Leave A Comment