Although SolarEdge’s stock (SEDG) is up nearly 10% in 2023, it took a hit following the release of its fourth-quarter results. Analysts expected fourth-quarter earnings of $1.54 a share on revenue of $880 million, but SEDG outperformed, reporting adjusted earnings of $2.86 a share on $890 million in revenue. This marked a 58% increase year-over-year in terms of revenue, and the whole solar segment brought in $837 million – a new record!
SolarEdge, which produces parts for solar power systems, including inverters and power optimizers, believes the high demand for renewable energy is spurred by increasing numbers of consumers who want to invest in the green energy industry and traditional energy concerns due to economic and geopolitical concerns. This industry has boomed by nearly 66% in a year, with high expectations to continue in the future.
However, even with the positive news, investors were still concerned with the stock falling after the news was released, and as a result, the stock price dropped 2.3% to $303.50 a share. Later during after-hours trading, the stock increased to $315.43 a share, showing a reversal from the initial decline. This might present a unique opportunity for investors to buy into SolarEdge’s stock at a good price, with a company announcing a shift into home energy systems in 2023.
Before looking at VectorVest analysis of SEDG, it’s essential to understand what’s happening with SolarEdge and the industry as a whole. SolarEdge had a good quarter, with 3.1 gigawatts of inverters and 217.6 megawatt-hours of batteries shipped in the fourth quarter, operational expenses increasing 26% year over year, and operating income increasing 105% year over year to $171.5 million.
SolarEdge’s cash and cash equivalent reserves increased from $530 million at the end of 2021 to $783.1 million at the end of 2022, while operating activity cash flow fell from $214.1 million to $31 million year over year. Meanwhile, long-term liabilities also increased around $130 million, to $1,199 million in 2022. Whereas the industry as a whole has an anticipated margin of 31 to 34 percent, SolarEdge estimates a gross margin of 28 to 31 percent, slightly less than its competition.
As a whole, SolarEdge outperformed during a difficult year, with revenues increasing 58 percent year over year. This was a significant improvement from its performance in 2021, with revenues of $1.9 billion. The solar segment also made new records, achieving $2.92 billion in revenue, up 54 percent year over year. Gross margin, however, fell from 32 percent to 27.2 percent year over year, as well as non-GAAP margin. Additionally, GAAP net diluted EPS fell from $3.06 the prior year to $1.65 in 2022.
In the financial reporting from 2022, SolarEdge announced several bullish metrics, including expecting Q1 earnings between $915 million and $945 million, with adjusted operational profits expected to fall between $150 million and $170 million. With that in mind, SolarEdge’s stock could be an attractive investment opportunity for investors who are interested in the renewable energy industry. But is SEDG a good buy? To answer that question, VectorVest analysis is necessary.
There's Lots of Positive About SEDG—But, Are There Any Red Flags?
To answer whether this is a good entry point into the SEDG stock, let's turn to the VectorVest analysis. The VectorVest system changes the way you trade for the better. It tells you everything you need to know about a stock in 3 ratings: relative value (RV), relative safety (RS), and relative timing (RT). Gaining insights from these ratings is fast and straightforward, as they sit on a simple scale of 0.00-2.00. Pick stocks with ratings above the average of 1.00 and win more trades!
Making things even easier, the VectorVest system provides you with a clear buy, sell, or hold recommendation based on these ratings. No more guesswork, no more emotion clouding your judgment. As for SEDG, here’s the current situation:
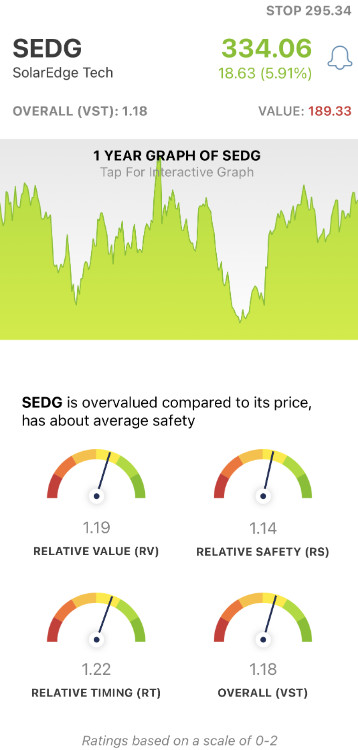
- Good Upside Potential: There are fairly mixed details about how much upside potential SEDG has. VectorVest rates it as good, giving an RV of 1.19 on a scale from 0.00 - 2.00. However, VectorVest also determined that SEDG's current price of $315.43 is significantly overvalued, with a current value of $187.67, meaning SEDG is trading at a premium of 68%.
- Good Safety: At this moment in time, VectorVest gives SEDG an RS rating of 1.14 - which is good on its scale from 0.00 - 2.00. It means that there's good financial consistency and financial performance in an industry that is expected to continue to grow in the future.
- Fair Timing: While there's good upside potential and safety ratings, SEDG's potential weakness is its relatively low timing score of 1.22. Compared to patterns in the stock's movement, there's an argument that as an investor, it might be best to wait and see how SEDG performs in the future. This rating is calculated based on the trend’s direction, dynamics, and magnitude. It’s analyzed day over day, week over week, quarter over quarter, and year over year, so you have the full viewpoint.
When comparing these metrics as a whole, SolarEdge has an overall rating of good, sitting at a VST score of 1.18 on a scale from 0.00 to 2.00. Does it earn SEDG a buy in the VectorVest system, though? To get a clear answer on your next move with this stock use our free stock analyzer here.


Want These Types of Insights at Your Fingertips so You Can Win More Trades?
Use VectorVest to Analyze any stock free. VectorVest is the only stock analysis tool and portfolio management system that analyzes, ranks and graphs over 18,000 stocks each day for value, safety, and timing and gives a clear buy, sell or hold rating on every stock, every day.
VectorVest advocates buying safe, undervalued stocks, rising in price. As for SEDG, it is overvalued with good upside potential, good safety, and fair timing.
Before you invest, check VectorVest! Click here to ANALYZE ANY STOCK FREE and see our system in action!


Leave A Comment