
by Leslie N. Masonson, MBA
Since November 15th, the home building companies have been among the best performers on the VectorVest Stock and ETF Viewers. This is not surprising based on the large demand for housing that can’t keep up with the number of buyers looking to move or upgrade their housing needs. The increase in mortgage rates over the past year has put a damper on the number of new willing buyers, but the recent interest rate decline over the past few weeks has seen a surge again. Also since many current home owners are not selling (because they have much lower monthly mortgage payments than if they bought a new house and took out a new mortgage at the higher 7 to 8% rates of today), new buyers have no choice but to buy new or rent.
And builders are also meeting the rental demand as well. In Delray Beach, Florida for example, there are multiple new rental apartments (over 1000 units) being built, as well as new homes selling for $750,000 to $3 million. They are selling quickly, believe it or not. In Palm Beach County there are 40,000 rental units under construction.
Sixteen home builders are among the top 100-ranked VST stocks. Moreover, five of these stocks are in the top 10 positions with VST rankings of 1.50 or higher. They are Installed Building Products, Inc. (IBP), Top Build Corp. (BLD), Simpson Manufacturing Co. (SSD), PulteGroup Inc. (PHM), and Hovnanian Enterprises Inc. (HOV). Likewise, of all the 10 building industries tracked by VectorVest, residential/commercial building is the #1 group out of 222. On November 1, this sector was ranked #100, so it has really taken off in the past six weeks to rise to the top spot.
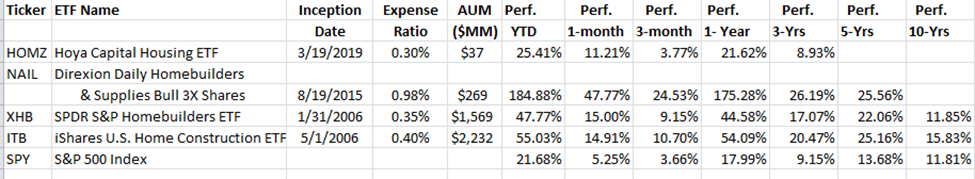
Investors can always invest in one or two of these top-rated stocks, but for more diversification and reduced risk, they should consider buying an ETF instead. According to ETFAction.com there are four home building ETFs in their 3,341 ETF database, shown in the table below (data as of December 8, 2023):
.
The two biggest players are XHB and ITB which both came to market in early 2006, and have Assets under Management (AUM) of $1.57 billion and $2.23 billion, respectively. HOMZ is the latest ETF in this small slice of the market with only $37 million in AUM after a 4.5 year life. With a performance below that of the other three competitive ETFs over m multiple time periods, its small AUM size, and average daily trading volume of only 1,480 shares, HOMZ’s future is bleak, as most ETFs need $100 million in AUM to stay in business. Clearly, this offers no benefit to investors compared to the other three. Both ITB and XHB have much higher daily trading volume of 3.1 million, and 4.1 million shares, respectively. NAIL comes in 324,000 shares a day. All three have sufficient volume for tight bid-to-ask spreads for both traders and investors.
Just a quick look at the performance figures on the table compared to the S&P 500 common benchmark indicates the superior performance of there ETFs over decades, and in particular year-to-date where the lowest performer, Hoya Capital Housing, returned 25.4% vs. 21.7% for the S&P 500, while the best performer, NAIL, has surged 185%, as it a triple leveraged ETF. Moreover, the performance of three of these ETFs over the 3- and 5-year timeframes has also far exceeded that of the benchmark. HOYA has been a slight laggard in the 3-year timeframe rising an average of 8.9% vs 9.2% for the S&P 500.
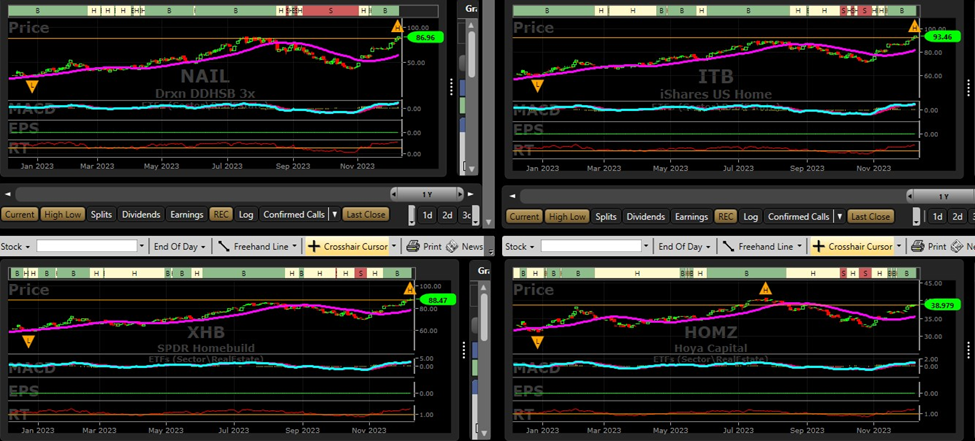
Performance Charts
Pictured below are the charts of the four ETFs in the home building category covering January 1, 2023 through December 8, 2023. The patterns are identical, except for the more pronounced ups and downs of NAIL which is to be expected, as it is a 3X leveraged ETF and possesses higher volatility in both directions than the other three. Its 47% one-month performance is truly amazing, to say the least.
As you can see, all but HOMZ closed on December 8 at their high for the year. HOMZ is very close to the previous high, and should be able to vault above it in the next few days if the uptrend continues. More conservative investors can consider ITB that overall has performed better than XHB over the years.
For more aggressive traders and investors, NAIL should be considered for purchase only by those with more experience and an iron stomach and who are fully aware of the workings of these leveraged products. They’re urged to go to the Direxion website to review the prospectuses, fact sheets, risks, and performance data. Investors who can keep a close eye on this ETF, if they decide to purchase it, can put up one-third the money and get triple the performance. For example, an investor considering a $10,000 investment in XHB or ITB could instead put $3,333 in NAIL and get the same bang for the buck. Nevertheless, a reasonable stop loss price should be established and adhered to if this ETF starts declining.
.
These homebuilding ETFs offer investors an opportunity to invest in a growing industry that has shown to be superior to the S&P 500 Index over the past five years or more. Remember that housing can be cyclical and all positions should have appropriate stop orders in place to protect against a possible loss of principal.


Want These Types of Insights at Your Fingertips so You Can Win More Trades?
Use VectorVest to Analyze any stock free. VectorVest is the only stock analysis tool and portfolio management system that analyzes, ranks and graphs over 18,000 stocks each day for value, safety, and timing and gives a clear buy, sell or hold rating on every stock, every day.
Before you invest, check VectorVest! Click here to ANALYZE ANY STOCK FREE and see our system in action!


Leave A Comment