
by Leslie N. Masonson, MBA
Decker Outdoors Corporation (DECK:NYSE) is based in Goleta, CA, and was founded in 1973. The firm employs 4,200 individuals. DECK is heavily involved in the global design, marketing and distribution of footwear, as well as causal accessories. Its popular premium footwear including the UGG and Hoka brands have contributed significantly to their earnings. Other brands include Teva, Sanuk, and Koolaburra. Products are sold through distributors and direct to consumers which includes retail stores and their e-commerce website.
How did I come across Deckers Outdoors? I recently signed up for a digital newspaper subscription because of my long-term interest in the stock market. I read a positive article about the company in the June 26 issue. So, I decided to get VectorVest’s recommendation, and was not surprised to see how well it was ranked.
Recently, Raymond James rated the stock an outperform rating, driven by steady demand for its products.” Moreover, Barron’s (June 26) had a positive mention, as did The Wall Street Journal on June 22 in an article titled “The Ugly Shoes Now Worth Billions” referring to their Hoka sneakers of choice for not only runners and nurses, but many other enthusiasts.
Deckers resides in the Apparel (Shoe) grouping and is ranked #1 in VST out of 10 other stocks in that category. The second and third ranked stocks Crocs Inc. and Sketchers USA. Looking at the broader Apparel sector Deckers is still ranked #1 out of 38 other stocks with the same two stocks ranked second and third.
One unexpected data point is that the Apparel Shoe industry is only ranked #182 out of 222 industries which is in the bottom 20% of all industry groups. That low ranking should give investors some cause for concern, since it is preferable to buy strong stocks in the strongest ranked industries which are currently Building (residential/commercial) and Steel (Alloy).
Currently, institutions are big fans of the stock as they hold 103% of the outstanding shares with FMR, LLC (Fidelity) owning a whopping 15.1% of the shares, with The Vanguard Group second at 9.5%, and Blackrock Inc. with 9.3%.
DECK Has High VectorVest Scores, is Undervalued, and Has Great Brands, So Its Future Looks Bright
Apparel stocks have not been top performers, but that does not mean that there are stocks in that group that should be eliminated from consideration. As we all know, companies with growing earnings and hot product lines can continue to work higher, even in mixed market conditions that we are currently experiencing.
VectorVest’s excellent metrics for DECK are as follows:
- Excellent Upside Potential: The Relative Value (RV) rating focuses on a stock’s long-term, three-year price appreciation potential. The current RV rating for DECK is 1.42 which is well above average on a scale of 0.00-2.00. The current stock price is $513.97, while VectorVest pegs its value at $575.02, so it is definitely undervalued.
- Excellent Safety: The Relative Safety (RS) rating is based on the company’s business longevity, financial predictability/consistency, debt-to-equity ratio, and additional risk parameters, including price volatility. Its RS rating of 1.47 is well above average, indicating below-average risk, and suitable for conservative investors.
- Good Timing: The Relative Timing (RT) rating focuses on the price trend over the short, medium, and long term. The components include price direction, dynamics, and price magnitude of price changes over daily, weekly, quarterly, and yearly comparisons. DECK has a slightly above average RT rating of 1.22 compared to the average of 0.98 for all the stocks in the database which means that the stock has been a better performer over multiple timeframes than the majority of stocks.
- Excellent Comfort Index: This index measures the consistency of a stock’s long-term resistance to severe and lengthy corrections. This index compares the individual stock to the fluctuation of the VectorVest Composite price that is measured on a scale of 0 to 2.00. At a level of 1.77, DECK’s rating is extremely high. Therefore, this stock is well suited for conservative investors.
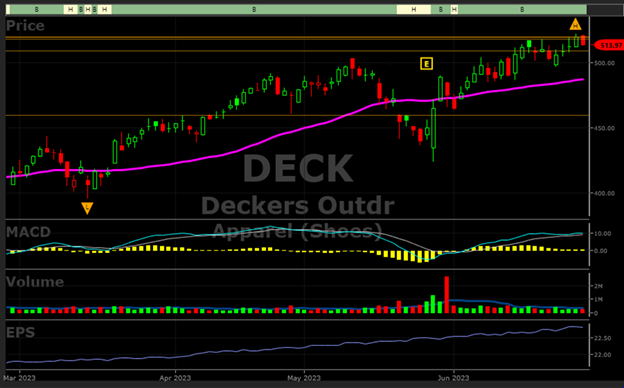
- Very Good Growth Rate (GRT): DECK’s 19% forecasted growth rate is measured over a forecasted three-year period. This fundamental factor is calculated in the VectorVest software, so you don’t have to do the work. The chart below highlights the multi-year positive earnings trend which has been rising steadily over timely.
- Very Good VST Score: The VST Master Indicator ranks 9,119 stocks from high to low and brings stocks with the highest VST scores to the top of the list. DECK’s VST is 1.37 which is considered a high score. Using VST enables users to identify stocks that are performing much better than average and DECK falls in that category.
Since its low of $212.93 on May 20, 2022, the stock has been riding its 40-day moving average with slight undercutting of the average every few months, but it hit its all-time high on June 28 at $520.12, a powerful advance of 144.3%. With a positive earnings trend, MACD reading (see chart below) and RT ranking, DECK has been one of the best market performers, as is rated a “BUY” by VectorVest.
As this stock has hit a new all-time high on June 28, probability favors a continued advance, as price momentum produces more momentum. Over the past week dozen days, the stock has been hovering around $500 to $518, but decisively took that level out on June 28 when it hit $522.60 intra-day. There is no overhead price resistance so there is clear sailing head subject to profit-takers along the way which actually happened today when it declined $6.15. Don’t forget that everyone who bought this stock at $520 has a profit. With its top ratings, investors should consider adding DECK to their watchlist. And of course, make sure VectorVest’s “Confirmed Calls” is on a BUY signal to have the wind at your back.


Want These Types of Insights at Your Fingertips so You Can Win More Trades?
Use VectorVest to Analyze any stock free. VectorVest is the only stock analysis tool and portfolio management system that analyzes, ranks and graphs over 18,000 stocks each day for value, safety, and timing and gives a clear buy, sell or hold rating on every stock, every day.
Before you invest, check VectorVest! Click here to ANALYZE ANY STOCK FREE and see our system in action!


Leave A Comment