
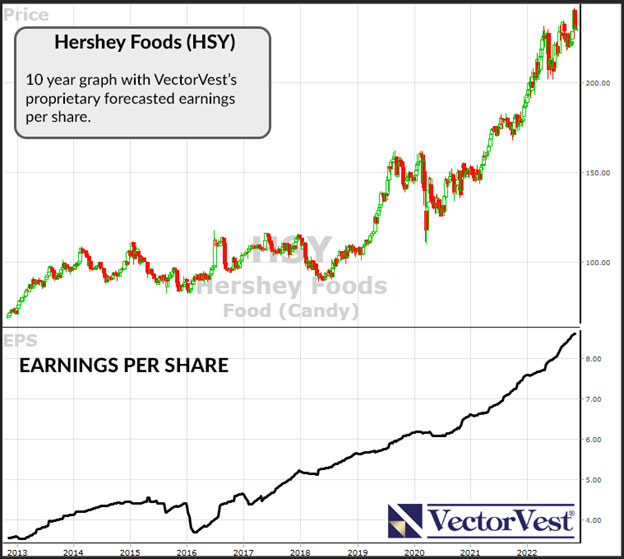
Late last week, The Hershey Company (HSY), an American multinational, reported not only a 13% sales increase for the third quarter, but also a projected 20 to 22% earnings growth for all of 2022. This is the result of increased demand for its well-known products including M&M’s, Kisses, Almond Joy, Skinny Pop Popcorn, Hershey’s Milk Chocolate Bar, Twizzlers, Reese’s Pieces, Kit-Kats, as well as cookies and cakes, among many others. Looking over 10-years, Hershey has been a steady earnings grower, except for a slight dip in 2016.
Probably, all Americans have been delighted by one or more of their snacks, as millions of others across the globe. This confectioner has just over 16,000 employees, and the company was founded in Derry Township, PA in 1894 by Milton Hershey. HSY has a decent average daily trading volume of 835,000 shares, and makes up 1.1% of the S&P 500 ETF Trust. Its current dividend is $4.14 or 1.80%. Currently, both Vanguard and Blackrock, Inc. hold nearly 10% each of the outstanding shares.
With the major market indexes down between 20% (S&P 500) to 33% (Nasdaq Composite) for 2022 so far with 75% of the S&P 500 stocks down for the year, it is not easy to find many stocks with solid financials that have a positive return. This year the energy stocks, as measured by XLE, are the exception with an eye-popping price advance of 66.4%. See our article on September 29, 2022, about Cheniere, an energy company, which has advanced nicely since then.
In a bear market, the usual place to turn for reasonable investments is defensive issues like bonds, consumer staples, healthcare and utilities. However many of those choices have not done well, especially bonds which had their worst performance in decades. Food stocks in particular are typically immune to stock price downdrafts. HSY with an 18.9% stock price gain is only one of the 25% of S&P 500 stocks having a positive yearly performance. It also rose 2.4% in the pre-market on Friday. Moreover, the stock reached an all-time high of $240.02 on October 31, although sliding to $229.03 at the Friday close. Stocks making new all-time highs are recommended by many stock market gurus like Dr. Bart DiLiddo, founder of VectorVest, Inc. and William J. O’Neil (founder of Investor’s Business Daily) and well-known trader Mark Minervini, among others. The reason is that these stocks have no former resistance levels to surpass and no former buyers at that level looking to break even.
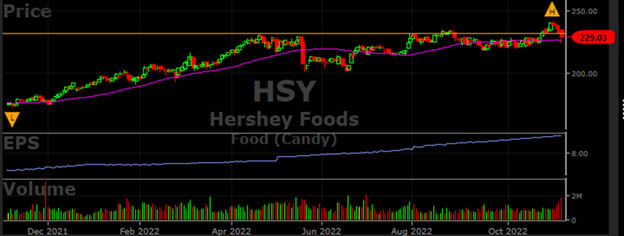
VectorVest indicators on a scale of 0.00-2.00, provide investors with the tools to be able to select stocks with the highest Value, Safety, Timing (VST) ratings to identify future winners, even in declining markets. Here’s the current chart for HSY which shows the positive trend this year.
The VectorVest ratings on Hershey are as follows:
- Fair Upside Potential: The Relative Value (RV) rating focuses on a stock’s long-term, three-year price appreciation potential. The current RV rating for HSY is an average at 1.08 – near the 1.00 level on the scale of 0.00-2.00. Moreover, the stock is overvalued at the current price of $229.03 compared to. VectorVest’s current value of the stock is $137.39.
- Good Safety: The Relative Safety (RS) rating is based on the company’s business longevity, financial predictability/consistency, debt-to-equity ratio, and additional risk parameters, including price volatility. The RS rating of 1.23 is above average, indicating a low risk.
- Fair Timing: The Relative Timing (RT) rating focuses on the price trend over the short, medium, and long-term. The components include price direction, dynamics, and price magnitude of price changes over daily, weekly, quarterly, and yearly comparisons. HSY has an average RT rating of 1.04. As the accompanying chart shows, HSY hit a new all-time high this past week and is above its 50-day moving average.
- Very Good Comfort Index: This index measures the consistency of a stock’s long-term resistance to severe and lengthy corrections. This index compares the individual stock to the fluctuation of the VectorVest Composite and is measured on a scale of 0 to 2.00. At a level of 1.34, clearly, HSY has an above average rating.
- Very Good Earnings Growth Rate (GRT): HSY’s 17% forecasted growth rate is well above average and is measured over a forecasted three-year period. This fundamental factor is calculated in the VectorVest software so you don’t have to do the work. Its chart highlights the up trending earnings and price movement.
- Good VST Score: The VST Master Indicator ranks nearly 9,200 stocks from high to low and brings to the top of the rankings those stocks with the highest VST scores. HSY score is 1.11 and is an example of the value of using the VectorVest analysis software to find above average stocks.
All things considered, is this a good time to buy HSY? To get the answer you can analyze HSY free using VectorVest to get the current buy, sell or hold recommendation.


Leave A Comment