
By Leslie N. Masonson, MBA
Robinhood Markets, Inc., ( HOOD: Nasdaq) based in Menlo Park, California, and incorporated in 2013, is a very popular trading app and former favorite pandemic meme stock that skyrocketed to $85 in August 2021, before cratering to $6.81 on June 16, 2022, a monstrous decline of 92%. Very few companies can come back from such devastation. Since February 21, 2023, the stock price has been range bound between $8.40 and $10.19, but has spurted up from its recent double bottom low of $8.40 to a high of $9.96 on May 11 after its latest earnings report, but gave back 12.2 % on Friday to close at $8.74
Robinhood Markets, Inc. is an American financial services company that offers a platform for traders and investors to transact their stock, ETF, options, gold, and crypto trades, commission-fee with no account minimums. Regular and retirement accounts are available. Also offered is educational content to bring their clients up the learning curve which includes many online tools, tutorials, and a financial dictionary.
At one point in the second quarter of 2021, there were 21.3 million active users of its trading platform. That number dwindled to 11.4 million in the 4th quarter of 2022 but has since rebounded to 11.8 million in the 1st quarter of 2023. This bounce coupled with an improved revenue picture in their May 10, 2023 earnings announcement may be the catalyst that marks the bottom of its spectacular fall from grace.
Not only did total revenue increase by 16% to $441 from the year-ago period, but also transaction-based revenues in equities jumped 29%, options gained 7%, but cryptocurrencies declined a measly 1%. However, one big negative was the $511 million net loss (translated into a negative $0.57 EPS) compared to a year ago loss of $167 million or negative $0.19 EPS. The company had net deposits of $4.4 billion sporting a 29% growth rate, and a large cash hoard of $5.5 billion. Moreover, its average revenue per user increased to $77 from $66 in the 4th quarter of 2022. The Market Cap is $8.9 billion with 774.4 million shares outstanding
The firm announced effective May 16 that users can trade 40 stocks and ETFs on a 24-hour basis from 8 a.m. to 8 p.m. during the week. Additional equities will be expanded over time. Moreover, HOOD announced a foray into Futures trading by the 2023 year-end pending regulatory approval. The CEO, Vlad Tenev, and top management continue to innovate and improve their offerings with the hopes of pulling in more business.
Moreover, HOOD is a popular holding of the big money managers, with institutions holding 71.5% and insiders 8.1%. Also, 398 institutions hold shares in their portfolios. For example, ARK Investment Management, Inc. owns 31.7 million shares spread among four of its ETFs. And even the conservative Vanguard Group purchased a 53.4 million total position in its mutual fund and ETFs. So there are some very astute investors who continue to hold this stick in anticipation of better times ahead.
HOOD Has Consistently Poor VectorVest Scores, But the Stock Could be Turning Around Right Here
VectorVest provides the guidance you need to make smart and unemotional investing and trading decisions. Just reading the financial media and buying what everyone is buying will not lead to success in the long run. Using the VectorVest approach will provide you with a time-tested numbers-based analysis of what each stock and ETF is worth and whether it should be bought or sold. So, pay attention to the ratings below and then make your decision.
Before investing, make sure to understand and review VectorVest’s HOOD’s key metrics:
- Fair Upside Potential: The Relative Value (RV) rating focuses on a stock’s long-term, three-year price appreciation potential. The current RV rating for HOOD is 0.92 which is below average on a scale of 0.00-2.00. VectorVest’s current stock value is pegged at $7.13 with a current price of $8.74.
- Poor Safety: The Relative Safety (RS) rating is based on the company’s business longevity, financial predictability/consistency, debt-to-equity ratio, and additional risk parameters, including price volatility. Its RS rating of 0.66 is well below average, indicating above-average risk.
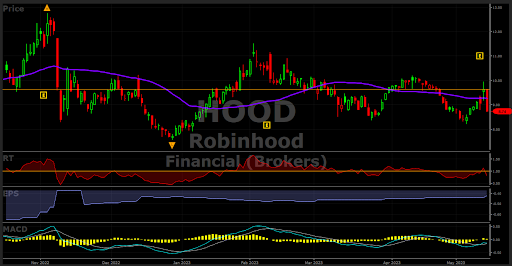
- Poor Timing: The Relative Timing (RT) rating focuses on the price trend over the short, medium, and long term. The components include price direction, dynamics, and price magnitude of price changes over daily, weekly, quarterly, and yearly comparisons. HOOD has a slightly below-average RT rating of 0.76 compared to the average 0.87 RT of all the stocks in the database which means that the stock has been performing slightly better than average over multiple timeframes.
- Very Poor Comfort Index: This index measures the consistency of a stock’s long-term resistance to severe and lengthy corrections. This index compares the individual stock to the fluctuation of the VectorVest Composite price that is measured on a scale of 0 to 2.00. At a level of 0.36, HOOD’s rating is significantly below average. Therefore, this stock should be considered by only very aggressive investors with a high tolerance for risk.
- Good Growth Rate (GRT): HOOD’s 13% forecasted growth rate is measured over a forecasted three-year period. This fundamental factor is calculated in the VectorVest software, so you don’t have to do the work. The chart below highlights the negative earnings trend over time, but the trend has been improving recently.
- Poor VST Score: The VST Master Indicator ranks 9,141 stocks from high to low and brings stocks with the highest VST scores to the top of the list. HOOD’s high score is 0.78. Using VST enables users to identify stocks that are performing much better than average, as well as those performing much worse than average. Unfortunately, HOOD falls in the latter category. Therefore, the stock is currently rated a “SELL”.
Considering the four “poor” metric ratings, this stock is one of the lowest-rated ones in the universe and one that most investors should avoid. Nevertheless, you may want to consider adding HOOD to your watchlist as a possible “speculative play” with a small equity position. Another way to play HOOD is with call-and-put options. There is decent options trading activity in these vehicles within a range of $0.75 of the current price, but traders need to be nimble and glued to their screens as the stock price is volatile. If you have never traded options or want to learn more consider one of VectorVest University’s seven options courses to enhance your knowledge.
Before jumping on board, first look to see if the stock price exceeds the $10.19 resistance level ($ 11.49-second resistance level), make sure the MACD is positive and its RT is above 1.00, the price remains above its 40-DMA, and buy only when the overall VectorVest stock market signal is “bullish” which is not the current situation. Check VectorVest’s recommendation on this stock after it breaches $10.19 to determine if there is a new “BUY” signal. Then make your decision. Analyze it for free using VectorVest


Want These Types of Insights at Your Fingertips so You Can Win More Trades?
Use VectorVest to Analyze any stock free. VectorVest is the only stock analysis tool and portfolio management system that analyzes, ranks and graphs over 18,000 stocks each day for value, safety, and timing and gives a clear buy, sell or hold rating on every stock, every day.
Before you invest, check VectorVest! Click here to ANALYZE ANY STOCK FREE and see our system in action!


Leave A Comment