
Sterling Infrastructure, Inc. (STRL:Nasdaq) is based in Woodlands, TX. The company was previously known as Sterling Construction and became public in 2001. Originally a bridge construction and highway company, Sterling has transformed itself as a civil construction company via acquisitions into an infrastructure services provider with a focus on providing U.S. customers with environmentally-responsible construction and services that specializes in E-infrastructure Solutions, as well as transportation and building solutions through its subsidiaries. The company has 3200 employees and reported its latest financial results on February 2023 for the full year 2022. Revenues increased 26%, gross margins 14.8% and net income 80%. Backlog at 2022-year-end was $1.41 billion, an increase of 7%.
STRL was a recent Barron’s Roundtable stock pick (January 23, 2023 issue). Scott Black, Founder and president, Delphi Management, Boston selected this stock for his 2023 picks along with JBL, CB, and COKE, all of which were recently posted on this blog. He mentioned in Barron’s that “New management came in several years ago with the goal of solidifying the base business, growing the higher-margin business segments, and achieving bottom-line growth. Free cash flow exceeds reported earnings.” Moreover, he stated that “Sterling has good bidding procedures, and benchmarks profitability on each of its projects to ensure there are no meaningful hidden errors or cost overruns. The company has good growth prospects, and strong financing and free cash flow.”
The markets were getting pummeled this past week, as evidenced by the S&P 500 losing 4.6%, now only with a measly 0.58% gain year-to-date. In comparison, STRL, hit an all-time high of $42 on March 8 and has advanced 18.5% for the year. This is after giving up about 7% on Thursday and Friday because of the combination of Fed comments and the collapse of SVB Financial Group which cratered 63% on Friday due to a run on its deposits.
Although STRL pays no dividends, it has a very low conservative P/E ratio of 11.23, well below that of average VectorVest stock at 45.55, and very appealing to conservative investors. Moreover, it has a forecasted earnings per share of $3.46 for the next year ahead. The average daily trading volume of nearly 280,000 shares certainly is sufficient for obtaining favorable trade executions.
VectorVest ranks STRL #2 in its universe of 143 building business sector companies, and #1 out of 19 stocks in the Heavy Construction industry group. Therefore, it is highly ranked against its competitors, as well as being a leader in the category. These rankings are understandable with its high sales growth at 26% over the past year, and its solid historical earnings growth.
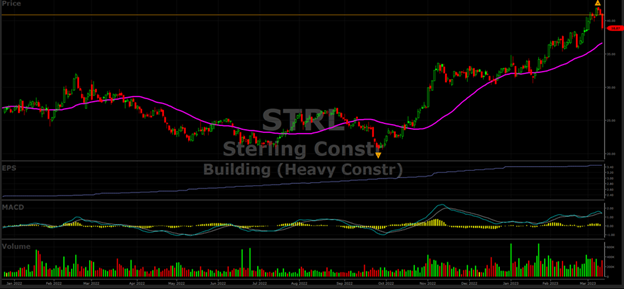
Currently, the stock price is well above the critical 40-day moving average which is not the case for the three major stock market averages, as of the Friday close. The stock has had a great run from its recent low on September 27, 2022, at $20.98 to its high on March 8, 2023, a run up of 100%, while by comparison the S&P 500 Index advanced only 9.6%. So being in the right market sectors is critically important to portfolio performance, and that is where VectorVest excels by identifying the top performers in all its industry groups for viewing by subscribers with a few mouse clicks.
STRL’s High VectorVest Scores Offer an Upbeat View of its Future Prospects
The VectorVest ratings of Sterling Construction are as follows:
- Excellent Upside Potential: The Relative Value (RV) rating focuses on a stock’s long-term, three-year price appreciation potential. The current RV rating for STRL is 1.42– considerably better than average on a scale of 0.00-2.00. VectorVest’s current value of the stock is $46.85, higher than its current price of 37.87; therefore it is considered undervalued with room to exceed its recent high.
- Good Safety: The Relative Safety (RS) rating is based on the company’s business longevity, financial predictability/consistency, debt-to-equity ratio, and additional risk parameters, including price volatility. The RS rating of 1.24 is nicely above average, indicating minimally above average risk.
- Very Good Timing: The Relative Timing (RT) rating focuses on the price trend over the short, medium, and long term. The components include price direction, dynamics, and price magnitude of price changes over daily, weekly, quarterly, and yearly comparisons. STRL has an above average RT rating of 1.30 compared to the average 0.82 RT of all the stocks in the database. Also, the chart’s MACD indicator was in an uptrend, but ticked down on March 9 and 10, as the stock declined over 6% in sympathy with the market rout over those two days.
- Good Comfort Index: This index measures the consistency of a stock’s long-term resistance to severe and lengthy corrections. This index compares the individual stock to the fluctuation of the VectorVest Composite price that is measured on a scale of 0 to 2.00. At a level of 1.23 STRL’s rating is notably above average. Therefore, this stock is certainly suitable for conservative investors.
- Very Good Earnings Growth Rate (GRT): STRL’s high 20% forecasted growth rate is measured over a forecasted three-year period. This fundamental factor is calculated in the VectorVest software, so you don’t have to do the work. The chart below highlights its up-trending earnings with an accelerating move upward since October 2019 (not shown) as the chart shows.
- Very Good VST Score: The VST Master Indicator ranks over 9,000 stocks from high to low and brings to the top of the rankings those stocks with the highest VST scores. STRL’s average score is 1.30 which is the upper 10% of the entire database. Using VST enables users to identify stocks that are performing much better than average, as well as the opportunity to find the cream of the crop in all its critical criteria with a few mouse clicks. This stock is currently in that category.
Considering the well-above average VectorVest scores and its positive earnings trend, this may be a good time to buy STRL, as it is only four days off its all-time intra-day high of $42.00? This could be a good time to jump in, as the stock has just dropped 7.5% in three days. Make sure that VectorVest’s market timing signal, stock ratings, and recommendation are checked out before you make a move. To see the STRL rating you can analyze it free using VectorVest to get the current recommendation.


Want These Types of Insights at Your Fingertips so You Can Win More Trades?
Use VectorVest to Analyze any stock free. VectorVest is the only stock analysis tool and portfolio management system that analyzes, ranks and graphs over 18,000 stocks each day for value, safety, and timing and gives a clear buy, sell or hold rating on every stock, every day.
Before you invest, check VectorVest! Click here to ANALYZE ANY STOCK FREE and see our system in action!


Leave A Comment