
VanEck Gold Miners ETF (GDX) – Ready to Pop After Its 28% Jump in the Past Month
Gold mining companies mine, explore and refine the commodity. The price of gold mining companies and ETFs, as well as the price of gold bars, have had a rough ride over the past decade, and have been in the doldrums with no increase in value. The conventional thinking is that holding gold is an inflation hedge and a store of value. Supposedly it will offer not only a safe haven in tough economic conditions but also offer some portfolio diversification. So far that has not turned out to be the case in 2022.
There is a difference, to investors, between buying physical gold, gold ETFs, gold miners, or their ETFs. Miners are subject to market risk and much higher volatility, in both up and down markets. Aggressive investors and traders may play leveraged gold miner ETFs for more action, but that is a treacherous environment where proper market timing is critical. Moreover, Gold mining ETFs are subject to a maximum long-term capital gain rate of 20%, while holders of the precious metal are subject to a 28% rate.
However, with the U.S. economy still unsettled with high-interest rates, this may be the time to jump on board, as gold tends to run in hot and cold multi-year cycles. Think of the 1980-1981 period when gold and silver were at much higher prices when inflation was the 10% to 14%.
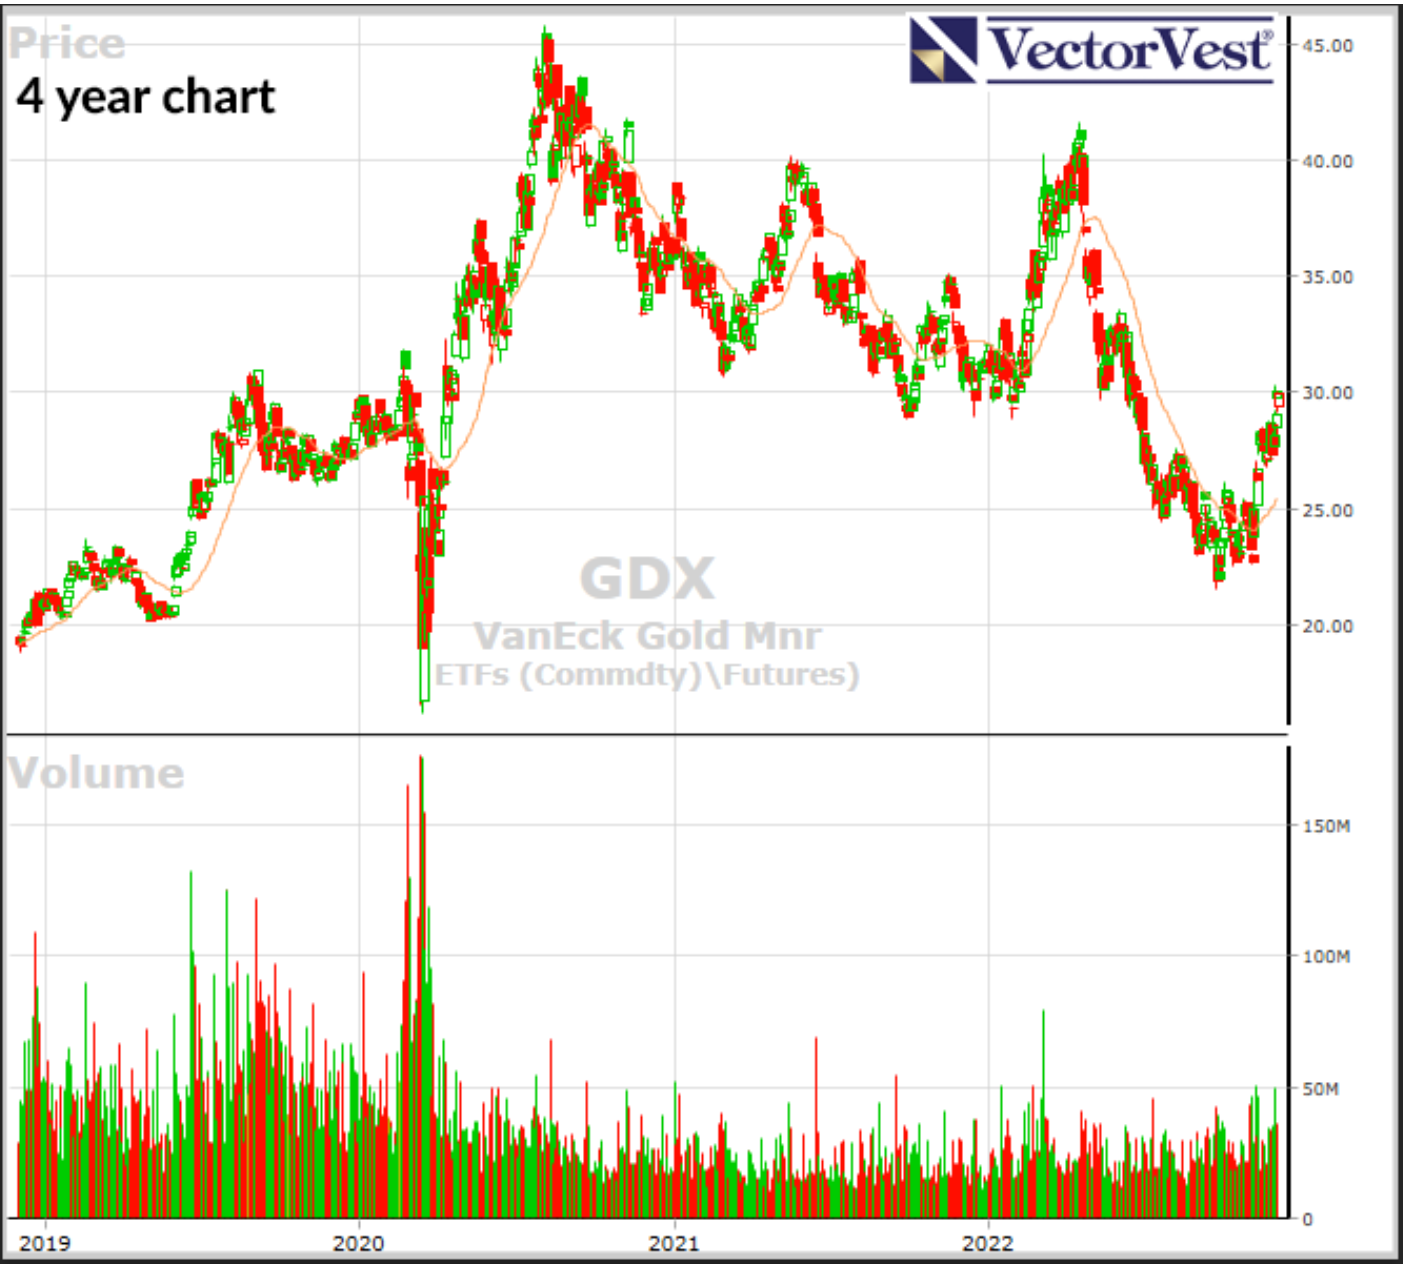
Interestingly, VanEck Gold Miners ETF (GDX) was the first ETF in its category to come into existence in May 2006. Currently, it is the number one ranked ETF in its industry group of 40 components measured by VST which is the VectorVest master indicator. GDX is a non-leveraged, open-ended ETF. Its all-time intra-day high was on September 19, 2012, at $54.79. Believe it or not, the November 25, 2022 price of $28.44 is the same price as on April 12, 2013. So there has been no progress in almost ten years. The current price has been at this support level three times in 2022, and now that price is acting as resistance. Clearly, if GDX penetrates this level to the upside, and especially if it pierces the 200-day moving average (dma) at $29.85, then the price may keep accelerating to reach its all-time high in the next three to six months, especially if the stock market turns south and inflation stays at current levels or higher. Also, its average daily trading volume is a door-busting 27.8 million shares. And its price is 13.6% above its 50-dma, and 4.5% below its 200-dma.
GDX, with 49 holdings, has an annual expense ratio of 0.51% and $11.8 billion in assets under management. Year-to-date it is down 4%, but is up 28% in the past month showing considerable upward momentum. It has generated 30-day cash inflows of $410 million, a clear sign of investor interest. Its top three holdings are Newmont Corporation, Barrick Gold Corporation, and Franco-Nevada Corporation representing 30% of its portfolio weight.
VectorVest subscribers were able to access a Special Report on November 25 titled “The Golden Approach” to review the selection of gold mining stocks, as well as the popular Midas Touch strategy to identify the leaders.
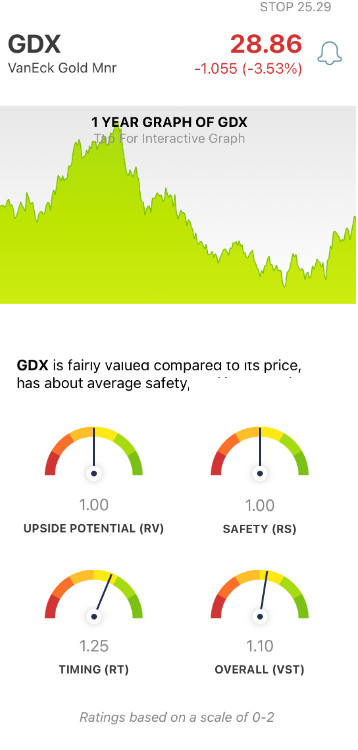
This ETF tracks the performance of gold and silver mining companies with a combination of small, mid-sized, and large companies. Note that VectorVest automatically assigns a 1.00 rating for both Relative Value and Relative Safety to all ETFs, as they are portfolios of stocks rather than individual securities. Also, the Earnings Per Share (EPS) and sales growth rates are set at zero for the same reason.
The critical VectorVest ratings on GDX are as follows:
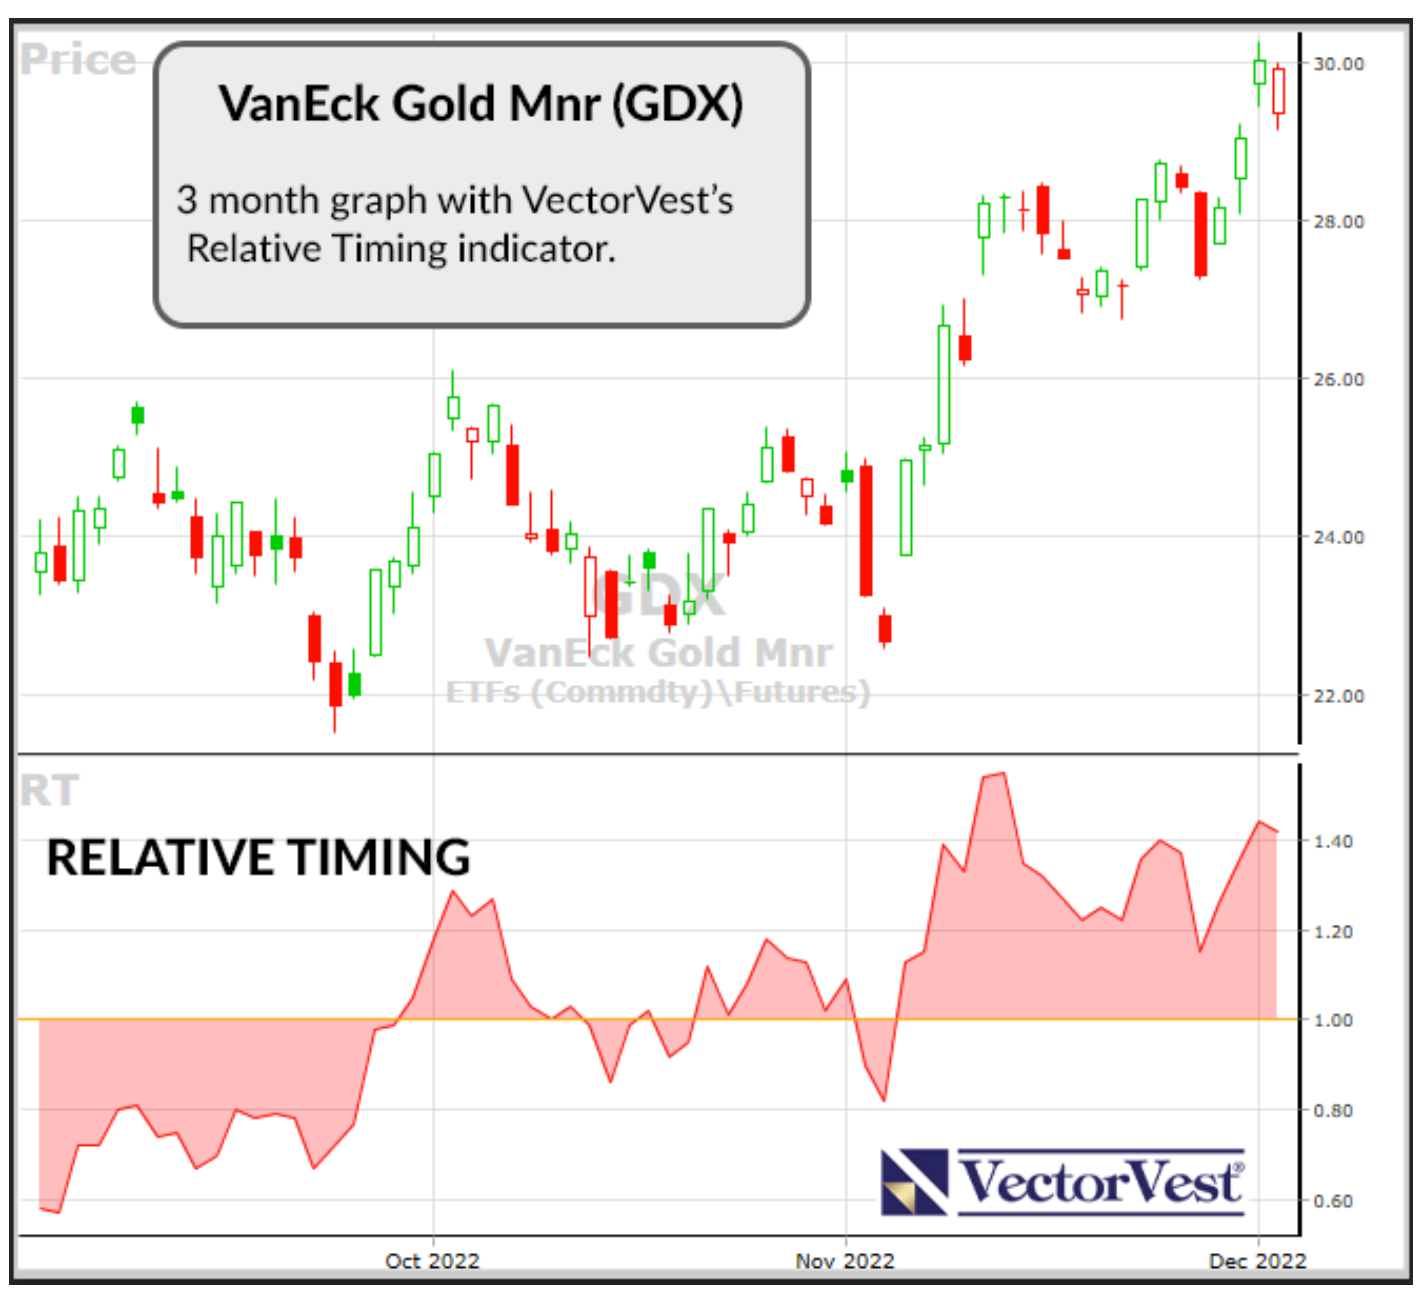
- Very Good Timing: The Relative Timing (RT) rating focuses on the price trend over the short, medium, and long term. The components include price direction, dynamics, and price magnitude of price changes over daily, weekly, quarterly, and yearly comparisons. GDX has an above-average RT rating of 1.37. As the accompanying chart shows, GDX hit its 2022 high on April 18, and is well above its 50-day moving average.
- Poor Comfort Index: This index measures the consistency of a stock’s long-term resistance to severe and lengthy corrections. This indicator compares the individual stock to the fluctuation of the VectorVest Composite (VectorVest’s exclusive index of over 9,000 stocks) and is measured on a scale of 0 to 2.00. At a level of 0.62, clearly, GDX has a below-average rating. This is not surprising as it is a volatile stock in a volatile sector.
- Good VST Score: The VST Master Indicator ranks nearly 9,200 stocks from high to low and brings to the top of the rankings those stocks with the highest VST scores. GDX’s score is above average at 1.16 and is an example of the value of using the VectorVest analysis software to find the strongest stocks in the VectorVest universe.
All things considered, with these mixed ratings is this a good time to buy GDX as it is at a critical support and resistance level? To get the answer you can analyze GDX free using VectorVest and view the current buy, sell or hold recommendation.


Want These Types of Insights at Your Fingertips so You Can Win More Trades?
Use VectorVest to Analyze any stock free. VectorVest is the only stock analysis tool and portfolio management system that analyzes, ranks and graphs over 18,000 stocks each day for value, safety, and timing and gives a clear buy, sell or hold rating on every stock, every day.
Before you invest, check VectorVest! Click here to ANALYZE ANY STOCK FREE and see our system in action!


Leave A Comment