
The VectorVest program is an amazing tool when it comes to finding stocks that serve a particular investment style or objective. From speculative to conservative, VectorVest will find the stocks that fit your investment profile.
The VectorVest Income Advisory newsletter is of course dedicated to helping you find the very best quality retirement stocks. With that goal in mind, let’s take a look at how we define 3 key parameters we use to find those companies.
Relative Safety: It’s all about Consistency and Predictability
Relative safety is an indicator of risk. It is computed from an analysis of the consistency and predictability of a company’s financial performance, debt to equity ratio, sales volume, business longevity, and price volatility among other factors. The higher that RS goes the more money they are making! On a 0 to 2 scale, a company with an RS rating above one is more predictable than the average stock in the database.
Basically, a high RS tells us that a company makes money quarter over quarter and year over year. An important piece of information for our portfolio management. As we manage the VVIA portfolios Relative Safety plays a vital role. It should in your portfolio as well.
YSG: What good is the dividend if the company can’t pay it
YSG is an indicator that combines DY (Dividend Yield), DS (Dividend Safety) and DG (Dividend Growth) into one vector on a 0 to 2 scale. Much like the VST vector. DY reflects dividend per share as a percent of price. DS is an indicator of the assurance that regular cash dividends will be declared and paid at current or higher rates for the foreseeable future. Stocks with DS above 75 typically have RS values well above 1. Finally DG is a forecasted annual growth rate of a company’s dividend based on historical dividend payments and predictability. It is a subtle yet important indicator of a company’s financial performance. It also provides some insight to the board’s outlook on the company’s ability to increase earnings.
CI: The Smooth and Steady Ride
CI is an indicator that reflects a stock’s ability to resist severe and/or lengthy price declines. I.E., a stocks price growth persistence. CI is quite different from RS in that it is based solely upon a stock’s long-term price history.
So with these definitions in place, let’s take a look at how they work. I created a search using just these indicators along with a Buy Rating on the stock: RS >= 1.25, CI >= 1.25 and DS >= 75 and YSG >= 1. Here are the top results:
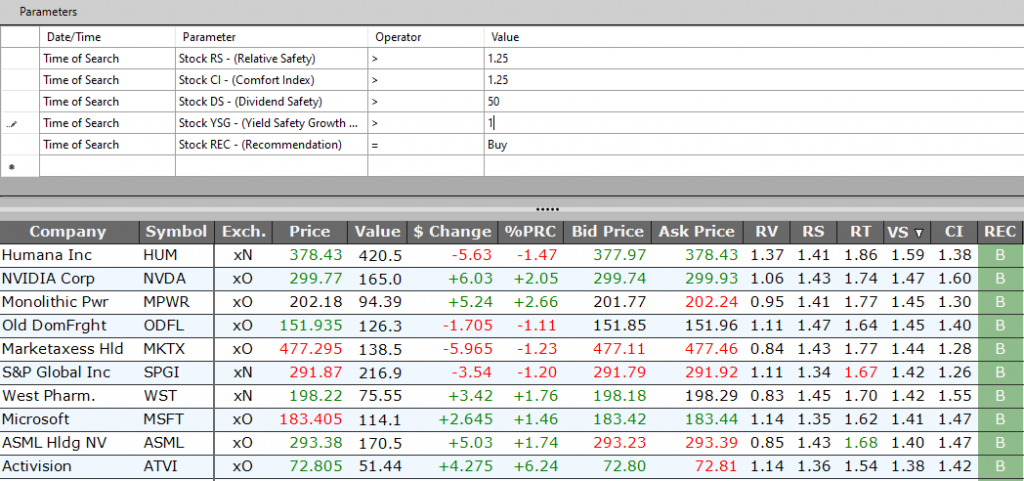
The numbers that stand out are the correlation between RS and DS. Both levels are excellent. Also the fact that all of these stocks are undervalued is always a great sign. And finally, based on the Buy rating, we know they are currently rising in price because to get a Buy Rec, we need VST and RT above 1 and the stock price above our STOP price AND the price trending higher from that STOP price.
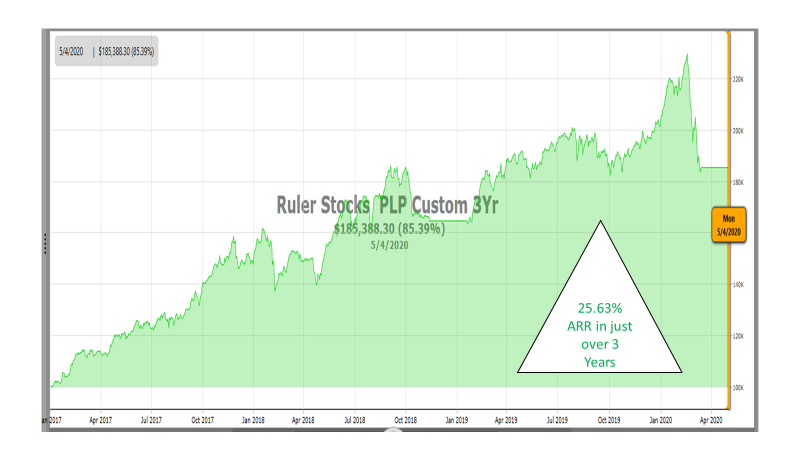
This is how our retirement portfolio should look.
Coupled with the VectorVest market timing system and the employment of reasonable stop criteria, we can build the foundation on which we can expand these opportunities. Not only will we appreciate capital in a safe manner, we can also generate income on these very same stocks by creating income generating option trades against them. From selling covered calls to selling puts to credit spreads, opportunities abound. So let the VectorVest program help you use your money to make more money, so your personal Comfort Index can rise.


Leave A Comment