


We see TradingView vs ThinkOrSwim talked about more than pretty much any other stock analysis comparison out there, and it’s easy to see why.
Both platforms give you more than 400 technical indicators and their own proprietary scripting languages. However, they solve very different problems for very different types of traders. Neither tells you whether a stock is actually worth adding to your portfolio, either. They just provide you with the raw insights you need to form your own conclusions.
We’ll compare ThinkOrSwim vs TradingView below to show you what each brings to your investing arsenal and help you narrow it down to the right fit.
You’ll also learn about the VectorVest stock advisory, which takes a radically different approach. It tells you exactly what to buy, when to buy it, and when to sell it. It has outperformed the S&P 500 index by 10x over the past 20 years and counting.
Set yourself up for success with the right tools today!
TradingView vs ThinkOrSwim vs VectorVest (Quick Comparison)
| Feature | TradingView | ThinkOrSwim | VectorVest |
| Best For | Charting and community | Options and multi-asset trading | Buy/Sell/Hold recommendations |
| Price | Free – $59.95/mo | Free (Schwab account) | $49.99 – $149/mo |
| Indicators | 400+ | 400+ | Proprietary VST system |
| Scripting | Pine Script | ThinkScript | N/A |
| Trade Execution | Via partner brokers | Built-in (Schwab) | Via partner brokers |
| Buy/Sell Signals | No | No | Yes (every stock, daily) |
| Free Tier | Yes | Yes (Schwab account) | 1 free stock analysis |
Pros and Cons of TradingView
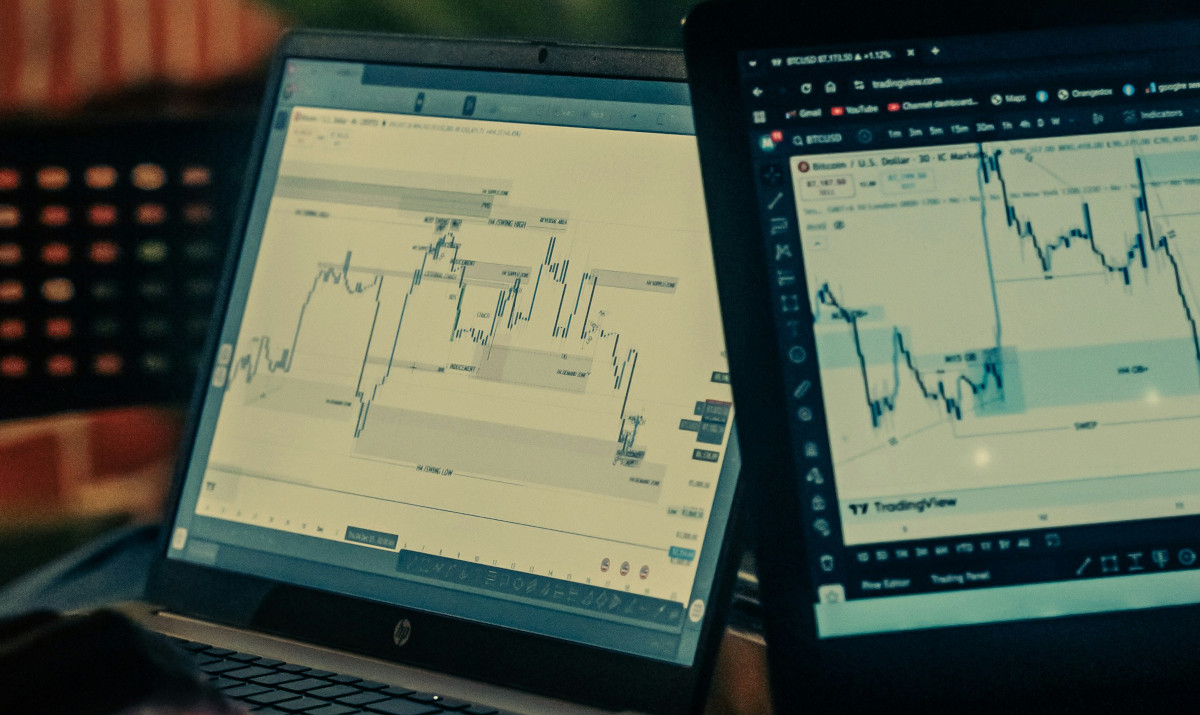
TradingView is one of the most trusted charting platforms in the world. It’s home to over 100 million investors who rely on it to uncover opportunities on a daily basis.
Pros
Credit where it’s due – TradingView has a legit free tier that a lot of investors decide is good enough that they never end up testing the paid plans. You get real-time data on most exchanges with basic charting capabilities.
However, the paid tiers are where the real value lies. They run $14.95-$59.95 per month and unlock more advanced chart layouts and alerts. You’ll also gain access to a thriving community that shares custom Pine Scripts you can implement in your own trading strategy if you’d like.
Speaking of Pine Script, it’s far easier to use than more trading platform languages. So although the learning curve can feel a little steep, it’s not as bad as it could be.
Cons
That learning curve we just spoke to is by far the biggest drawback with TradingView. It’s going to take some serious training and paper trading before you can fully utilize all that the platform has to offer. It’s complex. But that’s intentional. TradingView is made for the investor who wants to dig deep into the details and conduct all their own manual technical analysis.
Perhaps the most relevant con, though, is that you aren’t getting any sort of buy, sell, or hold guidance. You’re going to have to interpret charts and come to your own conclusions. That opens the door to human error, emotion, and guesswork.
Pros and Cons of ThinkOrSwim
ThinkOrSwim now lives under the Charles Schwab umbrella. It’s an incredibly versatile analysis platform that gives you all the tools you need to uncover and analyze stocks, options, futures, and more.
Pros
The biggest benefit of ThinkOrSwim is the simple fact that it’s free. There is no paid tier. You get everything the platform has to offer simply by creating an account and downloading the platform to your desktop. There’s zero account minimums, either.
The platform is home to 400+ indicators that you can overlay on charts to your heart’s content. You also gain access to free NASDAQ TotalView Level II data with any Schwab brokerage account.
ThinkOrSwim is great for paper trading, too, as the simulator provides $100k in virtual funds for you to test your strategy in real-time market conditions instead of delayed data feeds.
As far as options trading goes, ThinkOrSwim truly is in a league of its own. There’s nothing like it if you’re trying to quickly and easily analyze the probability of profit and risk profiles for any position. There are even tools that automate rolling covered calls!
Cons
If you think the learning curve of TradingView is steep, just wait till you try to get started with ThinkOrSwim. The desktop client is super dense, which is a blessing and a curse. It’s normal to spend a few weeks playing around inside it before feeling comfortable and confident.
You’re also going to need a PC with significant system resources to keep up. Otherwise, you’ll deal with lag during high-volume sessions – and a few moments could be the difference between capitalizing and missing your window of opportunity.
The transition from TD Ameritrade to Schwab has been far from seamless, too. A lot of people say things aren’t transferring over cleanly, which is impacting user experience.
But the same drawback we spoke about with TradingView is relevant here. ThinkOrSwim gives you a ton of data, and then leaves you to figure out what to actually do with it all. That’s why it’s worth comparing ThinkOrSwim vs TradingView vs VectorVest.
What is VectorVest?
This is a proprietary stock forecasting software that rates every stock on three dimensions: Value, Safety, and Timing. Each is placed on a simple scale of 0.00-2.00 with 1.00 being the average. Based on the overall VST rating, a stock is rated as a clear buy, sell, or hold.
This takes all the stress and uncertainty out of your investment decisions. You can just follow the VectorVest recommendations, trusting them to help you earn higher returns with less work and stress.
After all, the system has outperformed the S&P 500 index by 10x over the past 20+ years. All while calling every major market move along the way, from the Dot Com Crash to the Covid Crisis and everything in between. VectorVest’s market timing features help you protect your portfolio during murky waters and get back in when things are calm.
Market Launchpad starts at $49.99/mo and covers 9,500+ US stocks with a 10-minute daily process. Or, you can upgrade to the Premium Desktop plan ($149/month) for 16,000+ stocks and real-time data, pulled from the Nasdaq last sale feed.
There is less of an emphasis on charting and technical indicators with VectorVest, because the system does all the heavy lifting for you. You can pull up pre-curated stock screeners that align with your strategy, vet opportunities, and execute trades in a click thanks to brokerage integrations.
VectorVest is widely considered to be the #1 TradingView alternative, and it’s a superior system to ThinkOrSwim as well. But don’t just take our word for it. Let’s take a closer look at VectorVest vs TradingView vs ThinkOrSwim side-by-side-by-side below.
In-Depth Review of ThinkOrSwim vs TradingView (and VectorVest)
Tools like ThinkOrSwim and TradingView certainly have their place. Maybe you’re the type of trader who prefers to get in the trenches and build hyper-specific screeners. Or you want to validate every single trade using custom indicators.
If that’s the case, it makes sense to compare TradingView vs ThinkOrSwim directly. Otherwise, it’s worth looking at these types of platforms and VectorVest next to each other to see which really aligns with your strategy.
User-Friendliness
There’s no question which is easier between ThinkOrSwim vs TradingView. The browser-based interface TradingView has come up with is far more intuitive than the desktop platform of ThinkOrSwim. You can start charting on the very first day, and you should have the hang of it within a few days.
But VectorVest’s ease of use is really in a league of its own. There’s a wealth of quick-start educational resources for the platform, and it’s really as simple as understanding what the VST system tells you:
- Relative value: Compares a stock’s long-term price appreciation potential (forecasted three years out), AAA corporate bond rates, and risk. Far superior indicator than price to value alone.
- Relative safety: Assesses the financial consistency & predictability of a company, its debt-to-equity ratio, business longevity, sales volume, and price volatility.
- Relative timing: Based on the direction, dynamics, and magnitude of a stock’s price movement. Calculated day over day, week over week, quarter over quarter, and year over year.
Each sits on a scale of 0.00-2.00 with 1.00 being the average. Honestly, though, it can be as easy as following the clear buy, sell, or hold recommendation. The interface is so intuitive.
Technical Analysis Capabilities
This is where the TradingView vs ThinkOrSwim comparison is the closest. Both give you more than 400 built-in indicators and a proprietary scripting language, whether it’s Pine Script or ThinkScript. You can conduct very complex technical analysis with either tool.
One major difference is how you access custom work. TradingView’s community publishes thousands of free scripts so you technically don’t have to build your own. On the other hand, ThinkOrSwim relies on third-party forums like useThinkScript.com for code sharing.
Then there’s the backtesting side of things. You can use ThinkOrSwim’s OnDemand replay feature to backtest based on real historical tick data. TradingView’s replay tool more or less does the same thing, but we found it to be a little more refined.
VectorVest’s technical analysis features are mostly proprietary, although you can run traditional technical analysis on the desktop platform if you choose to. Speaking of historical performance as well, VectorVest is the only tool of its kind that shows you the track record for every call it has made over the years.
There are backtesting tools within VectorVest as well, such as AutoTimer. It goes beyond simply backtesting and helps you actually refine your winning plan – THEN empowers you to implement it.
Fundamental Insights
Another big gap between TradingView vs ThinkOrSwim is the fundamental insights they present you with. ThinkOrSwim has the undeniable edge here with 40+ data points based on Schwab’s in-house research reports. There’s even an integrated earnings calendar so you can stay posted for all the stocks on your watchlist or in your portfolio.
TradingView really doesn’t offer much more than basic financial statements. You’d need a separate tool for keeping track of fundamental analysis.
In contrast, the fundamental side of a stock is tracked through VectorVest’s RV rating. But you can also pull up all the basic fundamental data points you’d ever need to see, ranging from EPS to debt-to-equity ratio and much, much more.
Pricing and Plans
Remember, ThinkOrSwim is 100% free. Permanently. The only thing you pay for is trading commissions on options. It’s the obvious pick if you don’t want to put your credit card down.
TradingView does have a free tier as well, and most people find it fairly capable. But you’ll eventually want to upgrade to a paid tier for faster data and more indicators:
- Essential – $14.95/month
- Plus – $29.95/month
- Premium – $59.95/month
For the sake of comparison with TradingView vs ThinkOrSwim, VectorVest starts at $49.99 per month. Market Launchpad is plenty for a lot of newer investors. Otherwise, you’ll upgrade to Enhanced ($99/month) or Premium ($149/month). The highest tier is where you’ll gain access to real-time data and full automation tools. It’s worth every penny for active traders.
App Comparison
You probably want to take your trades on the go, so how does TradingView compare to ThinkOrSwim on the mobile app front? It’s the superior app experience according to most people who have tried both. The app closely mirrors the browser experience.
VectorVest’s stock advisory is the better pick across the board, though. It’s the most intuitive, polished mobile experience complete with the same VST ratings and market signals available on desktop.
So is TradingView Better Than ThinkOrSwim?
As we bring this guide to a close, how does TradingView compare to ThinkOrSwim? They’re pretty similar in the sense that you’ll get deep technical analysis capabilities with either. It just comes down to whether you want a steeper learning curve for free, or you want to pay for something a bit more polished.
But there are other nuances, too. For example, ThinkOrSwim makes more sense for options traders. Or anyone who’s already in the Charles Schwab ecosystem. It gives you way more fundamental analysis features, too.
You can learn more about TradeIdeas vs TradingView, StockCharts vs TradingView, or TrendSpider vs TradingView in our blog if you want to weigh other options. Otherwise, we highly recommend you give the VectorVest system a shot.
Who Should Consider VectorVest Instead?
VectorVest takes all the stress and uncertainty out of investing by clearly showing you what to buy, when to buy it, and when to sell it. There’s no need to bury yourself in raw data every morning only to spin your tires and struggle to really grow your portfolio. Trade smarter with VectorVest. Get a free stock analysis today and see what’s possible.



Leave A Comment