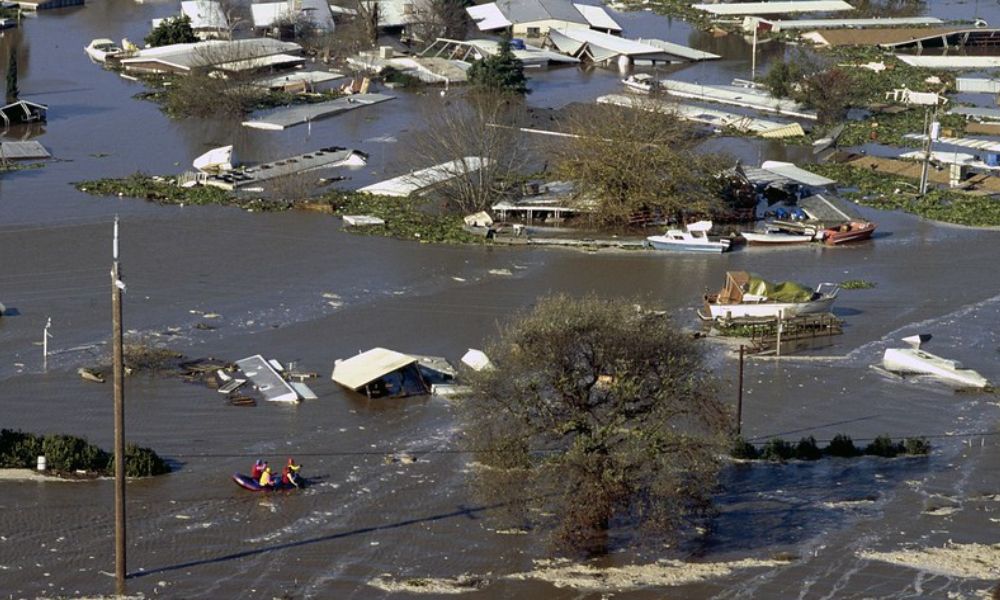
The golden state of California has been drenched in severe floods and heavy snow, resulting in Moody estimating economic losses of around $5-7 billion. The implications extend across sectors, encompassing residential, commercial, industrial, automobile, and infrastructure assets, but the damage is still coming on. On top of economic implications, Moody predicts that insured losses will range around $500 million to $1.5 billion, but a significant portion of the damage remains uncovered by insurance due to the low flood insurance penetration in California (ex., less than 2% of households in CA have flooding coverage). Following the crippling events, California is left vulnerable with widespread damage to highways, roads, and power networks, hurting businesses and moving the impact over to the market. Let’s dive into what the impact could be and how you can stay on top of individual stock movements.
Real estate, particularly homeowners in Southern California, is struggling with significant property damage due to the rain that has turned creeks and hillsides into mudslides. Unfortunately, the standard homeowners’ insurance policies do not cover losses from flood damage, mudslides, mudflows, and debris flows. In fact, that type of damage is typically excluded from typical homeowners’ insurance coverage. On top of that being excluded from typical policies, several major insurers have pulled out of California in the past year due to fires (including Allstate and State Farm), calling attention to the prevalent gap with the recent flooding. These issues could impact the housing market in unpredictable ways, with residents either moving and buying new homes or being crushed by the financial difficulties of their current homes.
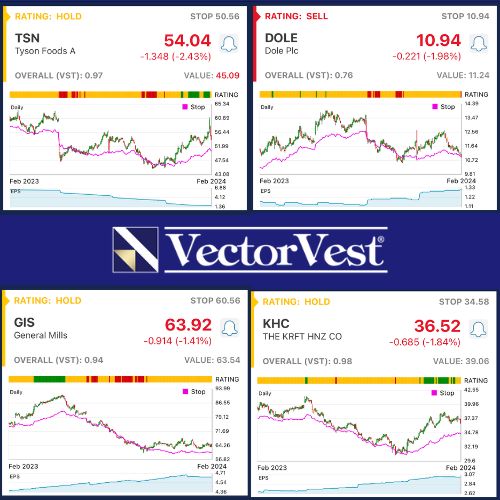
The most visible impact from the recent weather will hit food supplies and, therefore, the consumer staples sector. The wet season still has two months remaining, which could lead to increased vegetation growth with the additional rain or, more likely, based on the danger brought on by the flooding, could drive out farmers and end regular agricultural deliveries. Publicly traded companies that rely on these farmers and food include Dole Plc (DOLE), Tyson (TSN), Kraft Heinz Company (KHC), and General Mills Inc. (GIS), and more, all of which have been dipping in the last few weeks. With the impact to be felt within the coming year, farmers report ruined land, animal plants are being shut down due to safety hazards, and insurance companies are fighting to cover damages, hurting these companies even more. If you’re worried about the economic impact of these floods on stocks you own, VectorVest provides the software to evaluate companies impacted by unpredictable circumstances.
How to Assess Financial Turbulence for a Company
The events in California are nearly impossible to predict or provide a perfect outlook for impact, but investors still feel the tension as supply is hurt and companies feel the impact. Even with that turbulence, VectorVest provides a stock analysis that considers past, present, and future implications, not just the panic of now. A comprehensive financial analysis considers multiple factors beyond a single earnings report. VectorVest software assesses three key summary ratings—relative value (RV), relative safety (RS), and relative timing (RT)—each assigned a score ranging from 0.00 to 2.00, where 1.00 signifies the average. The culmination of these scores forms the overall VST (Value-Safety-Timing) rating, offering a definitive recommendation to either buy, sell, or hold a particular stock based on its collective evaluation across these critical dimensions.
To stay current on how macro events impact individual stocks, use VectorVest! The advanced software shows a company’s performance as an overview. You can see the trajectory and risks associated with the company through the three ratings, so check them out for Dole Plc (DOLE), Tyson (TSN), Kraft Heinz Company (KHC), and General Mills Inc. (GIS). You can learn more about how the system works or the current opportunity with any given stock through a free stock analysis today!


Want These Types of Insights at Your Fingertips so You Can Win More Trades?
Use VectorVest to analyze any stock free. VectorVest is the only stock analysis tool and portfolio management system that analyzes, ranks and graphs over 18,000 stocks each day for value, safety, and timing and gives a clear buy, sell or hold rating on every stock, every day.
Before you invest, check VectorVest! Click here to ANALYZE ANY STOCK FREE and see our system in action!


Leave A Comment