
While much has changed over the course of the stock market’s history, one thing that has never changed is the value of having a reliable, consistent approach to uncovering opportunities, validating them, and executing the trade.
One such method, a blend of art and science, has been the cornerstone for countless success stories: technical analysis.
But what is technical analysis of stocks, exactly? This intricate dance of numbers, patterns, and charts might seem daunting at first, but with it comes the power to predict potential stock movements with uncanny precision.
As you dive into this beginner’s guide, you’ll not only unravel the mystique behind technical analysis but also discover how modern tools are revolutionizing this age-old technique. Prepare to embark on a journey that might just redefine the way you perceive stock trading.
What is Technical Analysis of Stocks?
Let’s not waste any time – what is technical analysis of stocks? We’ll kick this guide off with a definition and a brief trip down memory lane as we look at the history of technical analysis.
Technical Analysis Defined
At its core, technical analysis is a methodology used to forecast the direction of stock prices through the study of past market data, primarily price and volume. Instead of delving into a company’s financials or industry conditions, technical analysis focuses on the study of price charts and other market-related variables to predict future price movements.
Imagine the stock market as a vast ocean. Fundamental analysis examines the depth, the marine life, and the quality of the water. In contrast, technical analysis studies the tides, currents, and waves. It’s all about recognizing patterns and anticipating future movements based on past behaviors.
Various tools and techniques, such as trendlines, support and resistance levels, and various indicators and oscillators, are utilized in this methodology. Traders meticulously analyze these to identify entry and exit points, make informed trading decisions, and, ultimately, to gain an edge in the market.
We’ll guide you through how to analyze a stock using technical analysis in just a moment. But first, let’s provide a brief history lesson.
The History of Technical Analysis
Tracing back to the 17th century, the origins of technical analysis can be found in the Dutch and Japanese markets.
The Japanese used a method known as candlestick charting, a technique that remains popular even today. This method primarily helped rice traders predict future prices based on the past price movements of rice.
Fast forward to the 20th century, Charles Dow’s groundbreaking work laid the foundation for what we now understand as modern technical analysis.
Co-founder of Dow Jones & Company, Charles Dow introduced the Dow Theory, which many consider the basis for contemporary technical analysis. His insights, emphasizing aspects like price action, volume, and trends, still resonate in today’s trading strategies and principles.
While technical analysis has faced its share of skepticism over the years, its staying power is undeniable. The advent of computer technology in the late 20th century supercharged its capabilities, with algorithms and software simplifying complex calculations, leading to more refined and faster analysis.
What is Technical Analysis Valuable For?
All that being said, what is technical analysis valuable for? Here’s what it can do to improve your trading strategy…
Predicting Short-Term Price Movements
One of the standout strengths of technical analysis lies in its prowess to gauge short-term price fluctuations.
While fundamental analysis digs deep into a company’s intrinsic value based on its financial health, earnings, or industry prospects, technical analysis hones in on immediate price trends and patterns. This makes it an essential tool for day traders and swing traders who capitalize on short-term price discrepancies.
By examining patterns formed on price charts, such as double tops, head and shoulders, or flag patterns, traders can often predict an imminent bullish or bearish move. This predictive power provides a significant edge in making timely and profitable trade decisions.
Assessing Market Strength and Potential Reversals
Another feather in the cap of technical analysis is its ability to measure the market’s vigor. Indicators like the Relative Strength Index (RSI) or the Moving Average Convergence Divergence (MACD) can highlight if a stock is overbought or oversold. Such insights play a crucial role in anticipating potential price reversals.
For instance, if a stock’s RSI exceeds 70, it might be in the overbought territory, signaling that a price drop could be on the horizon. Conversely, an RSI below 30 might indicate the stock is oversold, hinting at an upcoming price rally. You can learn more about the best moving averages in our blog.
Enhancing Trading Strategies with Data-Driven Insights
In the stock market, decisions fueled by emotions or gut feelings can often lead astray. Technical analysis serves as an anchor, grounding traders with data-driven insights. By offering a systematic approach, it helps in eliminating subjectivity from trading decisions.
Traders can set specific criteria using technical indicators to trigger buy or sell orders. For instance, a crossover strategy might involve buying a stock when its short-term moving average crosses above its long-term moving average. Such systematic tactics can aid in consistent profitability and mitigate potential risks.
No more wondering where your stock entry point is, no more questioning when to sell stocks for profit. And, you can effortlessly uncover swing trading stock picks through technical analysis too, helping you find the next opportunity each and every day. That being said, let’s walk you through putting it into practice.
Putting Technical Analysis Into Practice: How it Works
From market timing strategies to day trading vs swing trading strategies – even position traders and scalpers need to know how to use technical analysis. So, here’s how it works…
Chart Types: The Basics of Line, Bar, and Candlestick Charts
- Line Charts: Often the first chart a budding trader encounters, a line chart is simplicity personified. It connects the closing prices over a specified period, giving a streamlined view of a stock’s performance. It’s excellent for spotting the overall trend of a stock, but might not provide the granularity that other charts offer.
- Bar Charts: Taking a step further into detail, bar charts incorporate opening, closing, high, and low prices for a given period. Each “bar” gives traders a snapshot of the stock’s price movement within that period. The top of the vertical bar indicates the highest traded price, while the bottom shows the lowest. A small tick on the left denotes the opening price, and one on the right signifies the closing price. It’s a more informative alternative to line charts, giving a clearer picture of price range and volatility.
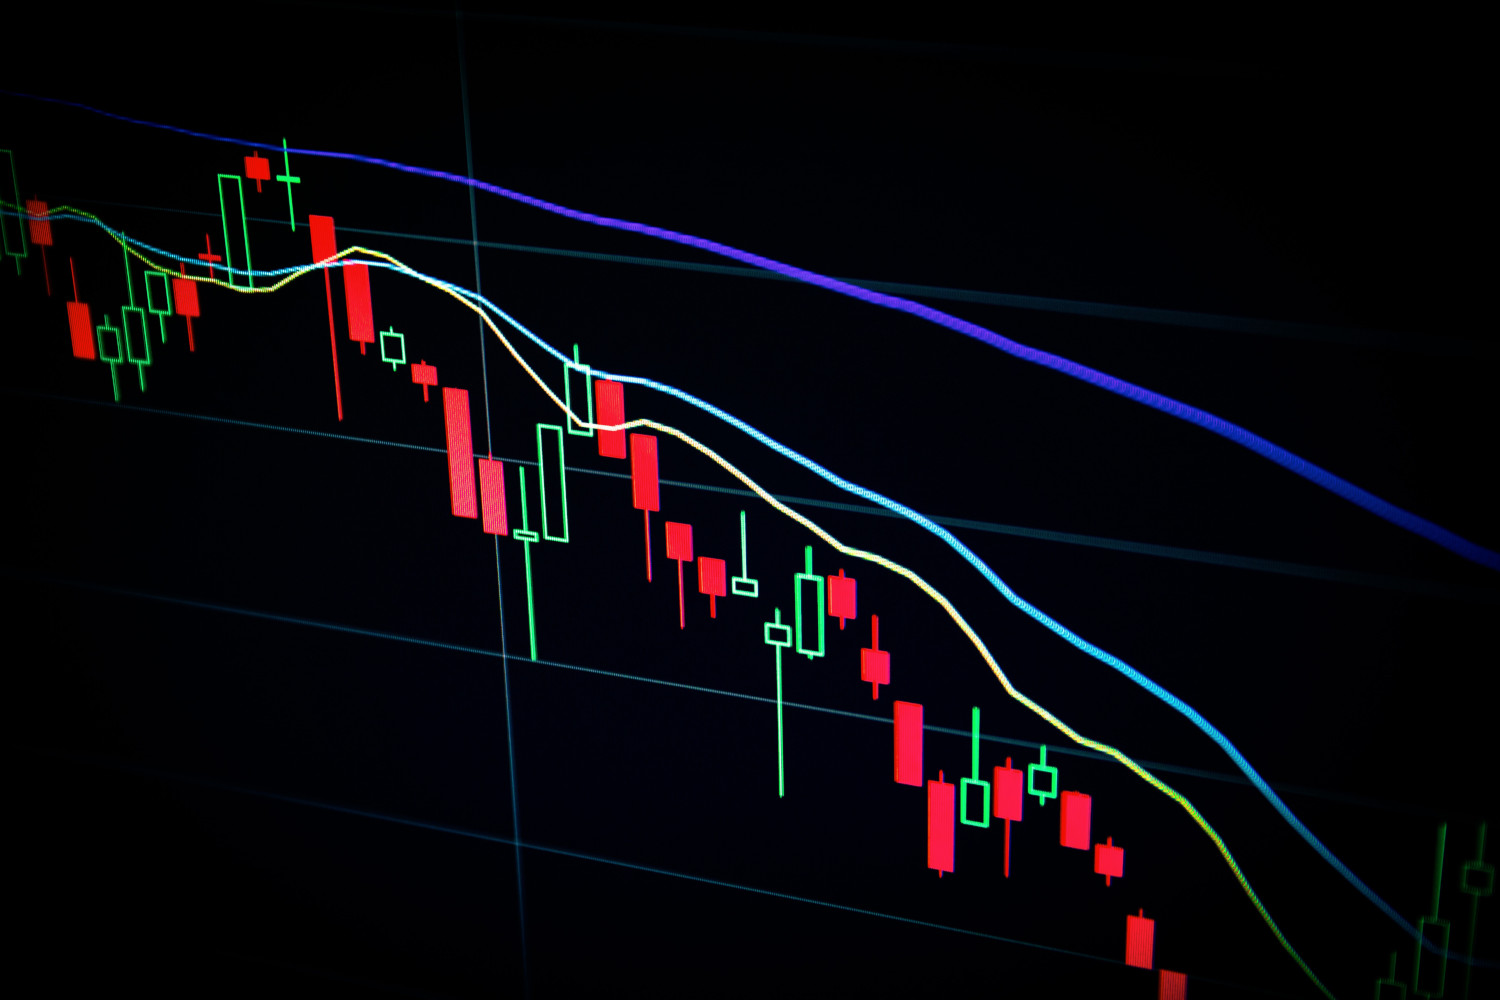
- Candlestick Charts: Of Japanese origin, candlestick charts have become the darling of many technical traders. Like bar charts, they display open, close, high, and low prices, but their unique presentation makes it easier to gauge market sentiment. A filled (or colored) candlestick indicates the closing price was lower than the opening, signaling a bearish period. Conversely, an empty (or differently colored) candlestick means the stock closed higher, indicating bullish sentiment.
Indicators Decoded: Moving Averages, RSI, MACD, and More
- Moving Averages (MA): One of the most fundamental tools, the MA smoothens price data to create a single flowing line. The two most common types are the Simple Moving Average (SMA) and the Exponential Moving Average (EMA). While SMA calculates an average of price data, EMA gives more weight to recent prices. When the stock price crosses its MA, it can signal potential buy or sell opportunities.
- Relative Strength Index (RSI): A momentum oscillator, RSI evaluates the speed and change of price movements, oscillating between zero and 100. Typically, an RSI above 70 indicates a stock might be overbought, while below 30 could suggest it’s oversold.
- Moving Average Convergence Divergence (MACD): A trend-following momentum indicator, MACD shows the relationship between two moving averages of a stock’s price. The MACD line’s crossover with its signal line can indicate potential buy or sell signals.
There are some of the best indicators for swing trading. There are others you should be familiar with too, but these three are a great starting point.
Pattern Analysis: Recognizing and Interpreting Common Patterns
Patterns form the bedrock of technical analysis. By recognizing these patterns, traders can predict potential future price movements.
- Head and Shoulders: Often a signal of reversal, this pattern consists of three peaks – the middle one being the highest (head) and the other two being relatively lower (shoulders).
- Double Top and Bottom: Resembling the letter ‘M’ or ‘W’, these patterns indicate reversals after a strong upward or downward trend.
- Triangles: Whether ascending, descending, or symmetrical, triangle patterns highlight consolidation in the market before a breakout.
- Flags and Pennants: These continuation patterns suggest a brief consolidation before the previous trend resumes.
We encourage you to learn more in our guide to swing trading patterns, as this is a crucial aspect of using technical analysis in swing trading strategies or any other strategy for that matter.
Deciphering the complex language of charts, patterns, and indicators can seem daunting. However, with persistence and the right resources, technical analysis can become an invaluable tool in your trading arsenal, unlocking potential previously unseen.
Keep in mind, though, that technical analysis is just one piece of the puzzle…
Bridging the Gap Between Technical and Fundamental Analysis
While there is no question that you need to know what technical analysis is if you’re going to trade stocks, fundamental analysis is worth exploring as well.
Understanding Key Differences
At the core, technical and fundamental analyses offer contrasting perspectives As you now know, technical analysis is the study of price action and market behavior, often using charts and indicators.
It operates on the premise that history tends to repeat itself and that market movements are influenced by collective psychology and patterns from the past.
Fundamental analysis, on the other hand, delves deep into a company’s intrinsic value by examining its financial statements, industry trends, management quality, and broader economic indicators.
It seeks to determine whether a stock (or any asset) is undervalued or overvalued based on its inherent strengths, weaknesses, and potential for growth. You’ll use this more frequently in retirement investment strategies, from fine-tuning your asset allocation in retirement to choosing the best mutual funds for retirement.
Benefits of Using Both Approaches
By utilizing both methods, traders and investors can validate their decisions. For instance, finding an undervalued company through fundamental analysis and then using technical tools to find the optimal entry point can lead to more confident and informed investment decisions.
Technical analysis can provide insights on market sentiment and potential future price movements, fundamental analysis gives a clearer picture of a company’s overall health and potential.
Merging these views offers a balanced outlook, preventing tunnel vision and promoting comprehensive market understanding. It will help with risk management as well.
However, even these two approaches fall short in considering their complexity and success rate. What you need is something foolproof that eliminates human error and guesswork while speeding up the process of analysis so you don’t feel shackled to your screen all day.
Technical Analysis Gets a Whole Lot Easier With VectorVest!
It’s no secret that mastering the intricacies of technical analysis can seem like a daunting endeavor, especially for those new to the world of trading.
Analyzing charts, identifying patterns, and interpreting myriad indicators – while these can offer profound insights into market behavior, they can also be overwhelming. But what if there was a tool that could simplify this entire process?
Enter VectorVest – the best stock analysis app for beginners and experts alike!
VectorVest is a revolutionary stock forecasting software that takes the complex world of technical analysis and distills it into understandable, actionable insights.
Instead of juggling multiple charts and indicators, users receive streamlined data, ensuring they spend less time deciphering the market’s moves and more time capitalizing on them.
At the heart of VectorVest’s unique approach are three proprietary indicators:
- RV (Relative Value): This metric gives a long-term price appreciation potential compared to other stocks. If you’re looking to invest in a stock, RV will show how it stacks up in terms of potential growth.
- RS (Relative Safety): An assessment of a stock’s risk compared to others. RS looks at the consistency and predictability of financial performance, giving you an idea of the stock’s stability.
- RT (Relative Timing): This is where the real-time technical analysis shines. RT assesses a stock’s short-term price trend, helping traders pinpoint optimal entry and exit points.
Each of these sits on a simple scale of 0.00-2.00 with 1.00 being the average. Just pick stocks with ratings above the average to win more trades!
It’s the best swing trading platform not just because it simplifies technical analysis, but because it brings the best stocks to swing trade right to your screen on a daily basis. Our proprietary stock screeners work around the clock so your next trade is always a click away.
The system has outperformed the S&P 500 index by 10x over the past two decades and counting. It’s called every major market move throughout that timeframe. Wouldn’t it be nice to have a system that can do all that in your arsenal?
Whether you’re a novice trader taking your first steps or a seasoned pro looking for an edge, VectorVest is designed to cater to all. With its user-friendly interface, even those new to technical analysis can start recognizing patterns, trends, and potential opportunities with ease. Increase your swing trading returns with our solution today!
Bringing Our Beginner’s Guide on Technical Analysis of Stocks to a Close
So, what is technical analysis of stocks? It provides traders with a robust framework, empowering them to interpret market rhythms and make informed decisions.
By combining time-tested techniques with modern-day technology, such as VectorVest, traders can elevate their strategies, ensuring they’re not only responsive to the market’s ebbs and flows but are also consistently ahead of the curve.
Yet, the journey of trading is perpetual, with new lessons at every turn. As you delve deeper into the world of technical analysis, remember that tools like VectorVest are there to simplify the complex, offering a streamlined approach to stock evaluation.
Want more swing trader tips? Learn the basics in our detailed beginner’s guide – what is swing trading? Or, hone in your strategy with more advanced tips on swing trading for beginners, best time frame for swing trading, buying the dip, buying and selling stocks same day, and more.
By harnessing the power of both fundamental and technical insights, you’ll be well-equipped to navigate the volatile waters of the stock market, making decisions that are both informed and strategic.
Set up your desktop app or mobile stock advisory app today, or get a free stock analysis to see what the system can do for you!


Leave A Comment