Geopolitical concerns have dominated investor’s attention for the last few months, causing stock prices to wither and, more recently, soar on expectations of a quick victory in Iraq. The primary benefit of an easy win over Iraq is that it would eliminate a major factor inflicting pain on the market. Unfortunately, it will not solve the market’s problems. That’s up to the economy.
As you know, stock value is driven by earnings, inflation and interest rates. Value rises when earnings go up and inflation and interest rates decline. Typically, a strong economy leads to rising earnings, which is good, and rising inflation and interest rates, which are bad. So investors are constantly balancing these factors against each other.
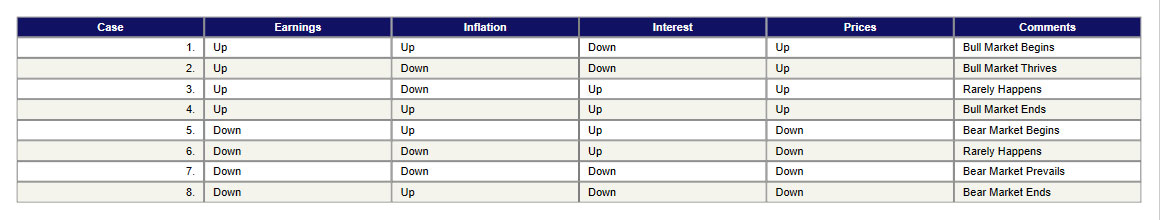
With three factors, each of which can move up or down, there are eight combinations. This array of combinations is called the “Truth Chart.” It appears as follows:
Click to enlarge
Case (2) reflects the best of all worlds, a rare combination of a strong economy with rising earnings, falling inflation and interest rates. This is the so called “Goldie Locks” scenario. It prevailed from January 1995 to October 1997.
This happy scene was rudely interrupted in October 1997 by the “Asian Currency Crisis,” which sent earnings, inflation and interest rates tumbling and created the Case (7) scenario. Case (7) did not last long, however, since inflation began to rise from extremely low levels in July 1998. Enter Case (8).
Dr. Greenspan lowered interest rates in rapid succession in October 1998, giving the market a tremendous boost. The world economies began to recover shortly thereafter, causing short-term interest rates to begin rising. Earnings also began to turn North in January 1999, enter Case (3).
Case (1), one in which earnings and inflation are rising while interest rates are falling, is the usual combination of factors which fosters Bull markets. Case (3) rarely happens. Although Dr. Greenspan said he was fighting “supply-demand imbalances,” he began raising interest rates in August 1999, bringing rise to Case (4).
Investors, flush with success from the Bull Market, continued to push stock prices higher and higher, even though Dr. Greenspan continued to raise interest rates. The Fed always wins this battle. Case (4) prevailed from mid-1999 to October 2000, when earnings peaked. Enter Case (5).
Case (5) lasted from October 2000 until January 2001 when Dr. Greenspan began lowering interest rates. The economy went into recession in March 2001, and Case (6) never happened. Once the economy weakened and earnings started to go down, Case (7) occurred again.
In 2001, Sir Alan lowered interest rates again and again. He ignited an auto and housing buying spree, although the economy remained weak. Inflation has been rising for several months now and earnings are not. We are in a Case (8) scenario and looking for the end of the Bear market. The war rally is nice, but the new Bull market will not get rolling until earnings begin to rise again. Yes, we have heard it over and over that earnings are rising. But are they? Next week, I’ll tell you more about the Truth Chart.


[…] inflation and interest rates rising. Refer to Dr. DiLiddo’s essay on March 21, 2003, called “The Truth Chart” in VectorVest US, which shows how we define the various Bull and Bear Market Scenarios. We can […]