
A few weeks ago, we published a guide designed to show first-time swing traders the ropes.
This is an excellent trading strategy if you know how to use the methodology — and how to identify the right stocks for that strategy.
As a quick refresher, here are the tips we recommend all swing traders keep in mind:
- Be very picky about the stocks you select.
- Make sure that the stocks you’re following have a strong upward trend.
- Make sure the market itself is trending upward.
- Have clear rules regarding your money and the size of your position, and stick to those rules.
For market timing, the VectorVest Color Guard is useful in deducing whether the market is trending upward and whether it’s safe to get into the market — that’s what a green light in our Color Guard system means.
For setting clear rules regarding your position, have a look at our guide on rules-based trading.
That leaves Tip No. 1, being picky about the stocks you select. How do you identify a potential swing trade candidate, anyway?
That’s what this post will cover. There are clear parameters that define the very best swing trade stocks — and our information has identified four such current opportunities.
The Indicators to Look for when Researching Swing Trade Candidates
Within the VectorVest tool, you will find three indicators that, together, can help you filter for the best stocks to swing trade.
Those include:
- Comfort Index (CI). This number, expressed as a figure between 0.0 and 2.0, is a strong indicator of a stock’s ability to resist price declines. A good swing trade candidate has a CI above 1.3.
- Relative Value (RV). This number, expressed as a figure between 0.0 and 2.0, is a strong indicator of a stock’s long-term price appreciation potential. A good swing trade candidate has an RV above 1.3.
- Earnings Growth Rate (GRT). This number, expressed as a percentage, forecasts a company’s rate of growth one to three years out. This number is a strong indicator of a stock’s future price trend, and a good swing trade candidate has a GRT above 20%.
Armed with these three parameters, we can dive into the VectorVest tool to identify the stocks you can try out swing trading strategies on right now.
An important note before we proceed: It’s a good idea to examine each stock’s support. You can do this in VectorVest with the support and resistance tool.
1. Micron Tech (MU)
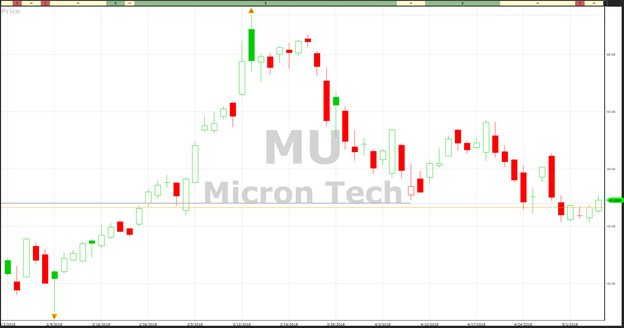
Indicators as of May 4, 2018
- CI = 1.58
- RV = 1.90
- GRT = 43%
A semiconductor manufacturer based in Boise, Micron Tech shares have enjoyed an incredible bull run over the last two years. The past few weeks, however, have seen share prices continuing to search for new lows.
Michael Wiggins De Oliveira at Seeking Alpha says this merely means investors can buy MU at a discount right now. That said, the company is facing a class-action legal battle over allegations that it, along with other a couple of other big tech companies, purposely limited supplies of DRAM chips to inflate prices.
2. MKS Instruments (MKSI)
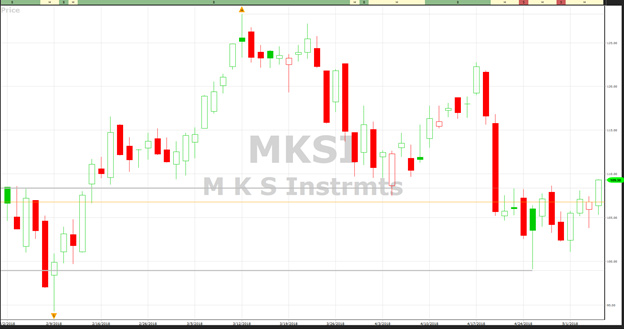
Indicators as of May 4, 2018
- CI = 1.43
- RV =1.72
- GRT = 32%
Massachusetts-based MKS Instruments is another tech company whose shares have been riding a long-term upward trends. MKS Instruments supplies a variety of devices and systems that are crucial for manufacturers across a number of industries.
With strong Q1 2018 numbers and record revenue figures in some divisions, MKSI is a stock that many analysts have their eyes on right now.
3. Fiat Chrysler Auto (FCAU)
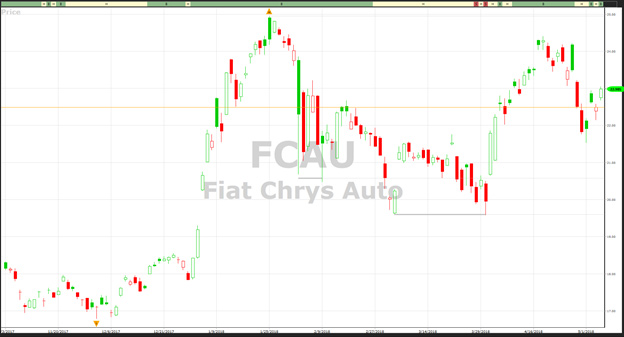
Indicators as of May 4, 2018
- CI = 1.77
- RV = 1.56
- GRT = 27%
One of the world’s big automotive companies, Fiat Chrysler has seen its shares really take off in the last 18 months. The American love for SUVs is a big reason why.
Case in point: Fiat Chrysler’s Q1 2018 statement showed a 60% jump in profits over Q1 2017, largely thanks to Jeep sales, the Detroit Free Press reports. The lower corporate tax rate, passed by the 2017 Republican Congress, has further fueled investor enthusiasm over the last several months.
4. Mastercard, Inc. (MA)
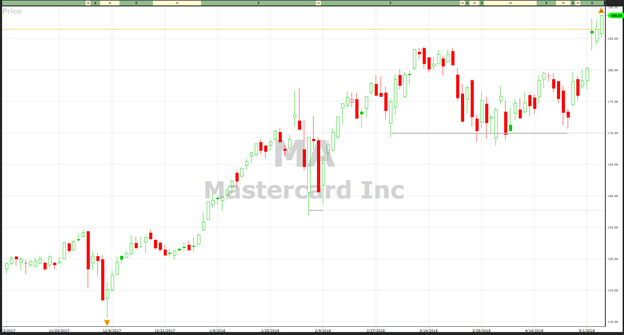
Indicators as of May 4, 2018
- CI = 1.57
- RV = 1.28
- GRT = 19%
New York-based financial services giant Mastercard has been on a tear for years, but the last 24 months have been especially kind to shareholders. And though its Q1 2018 has lagged a little behind its primary competitor, Visa, Mastercard is poised to break out in Q2, says Investopedia’s Michael Kramer.
Of note, too, is the fact that Mastercard recently filed a patent application for a blockchain network, the technology bitcoin is built on. This kind of investment in cutting-edge tech is a strong sign of growth.


Leave A Comment