
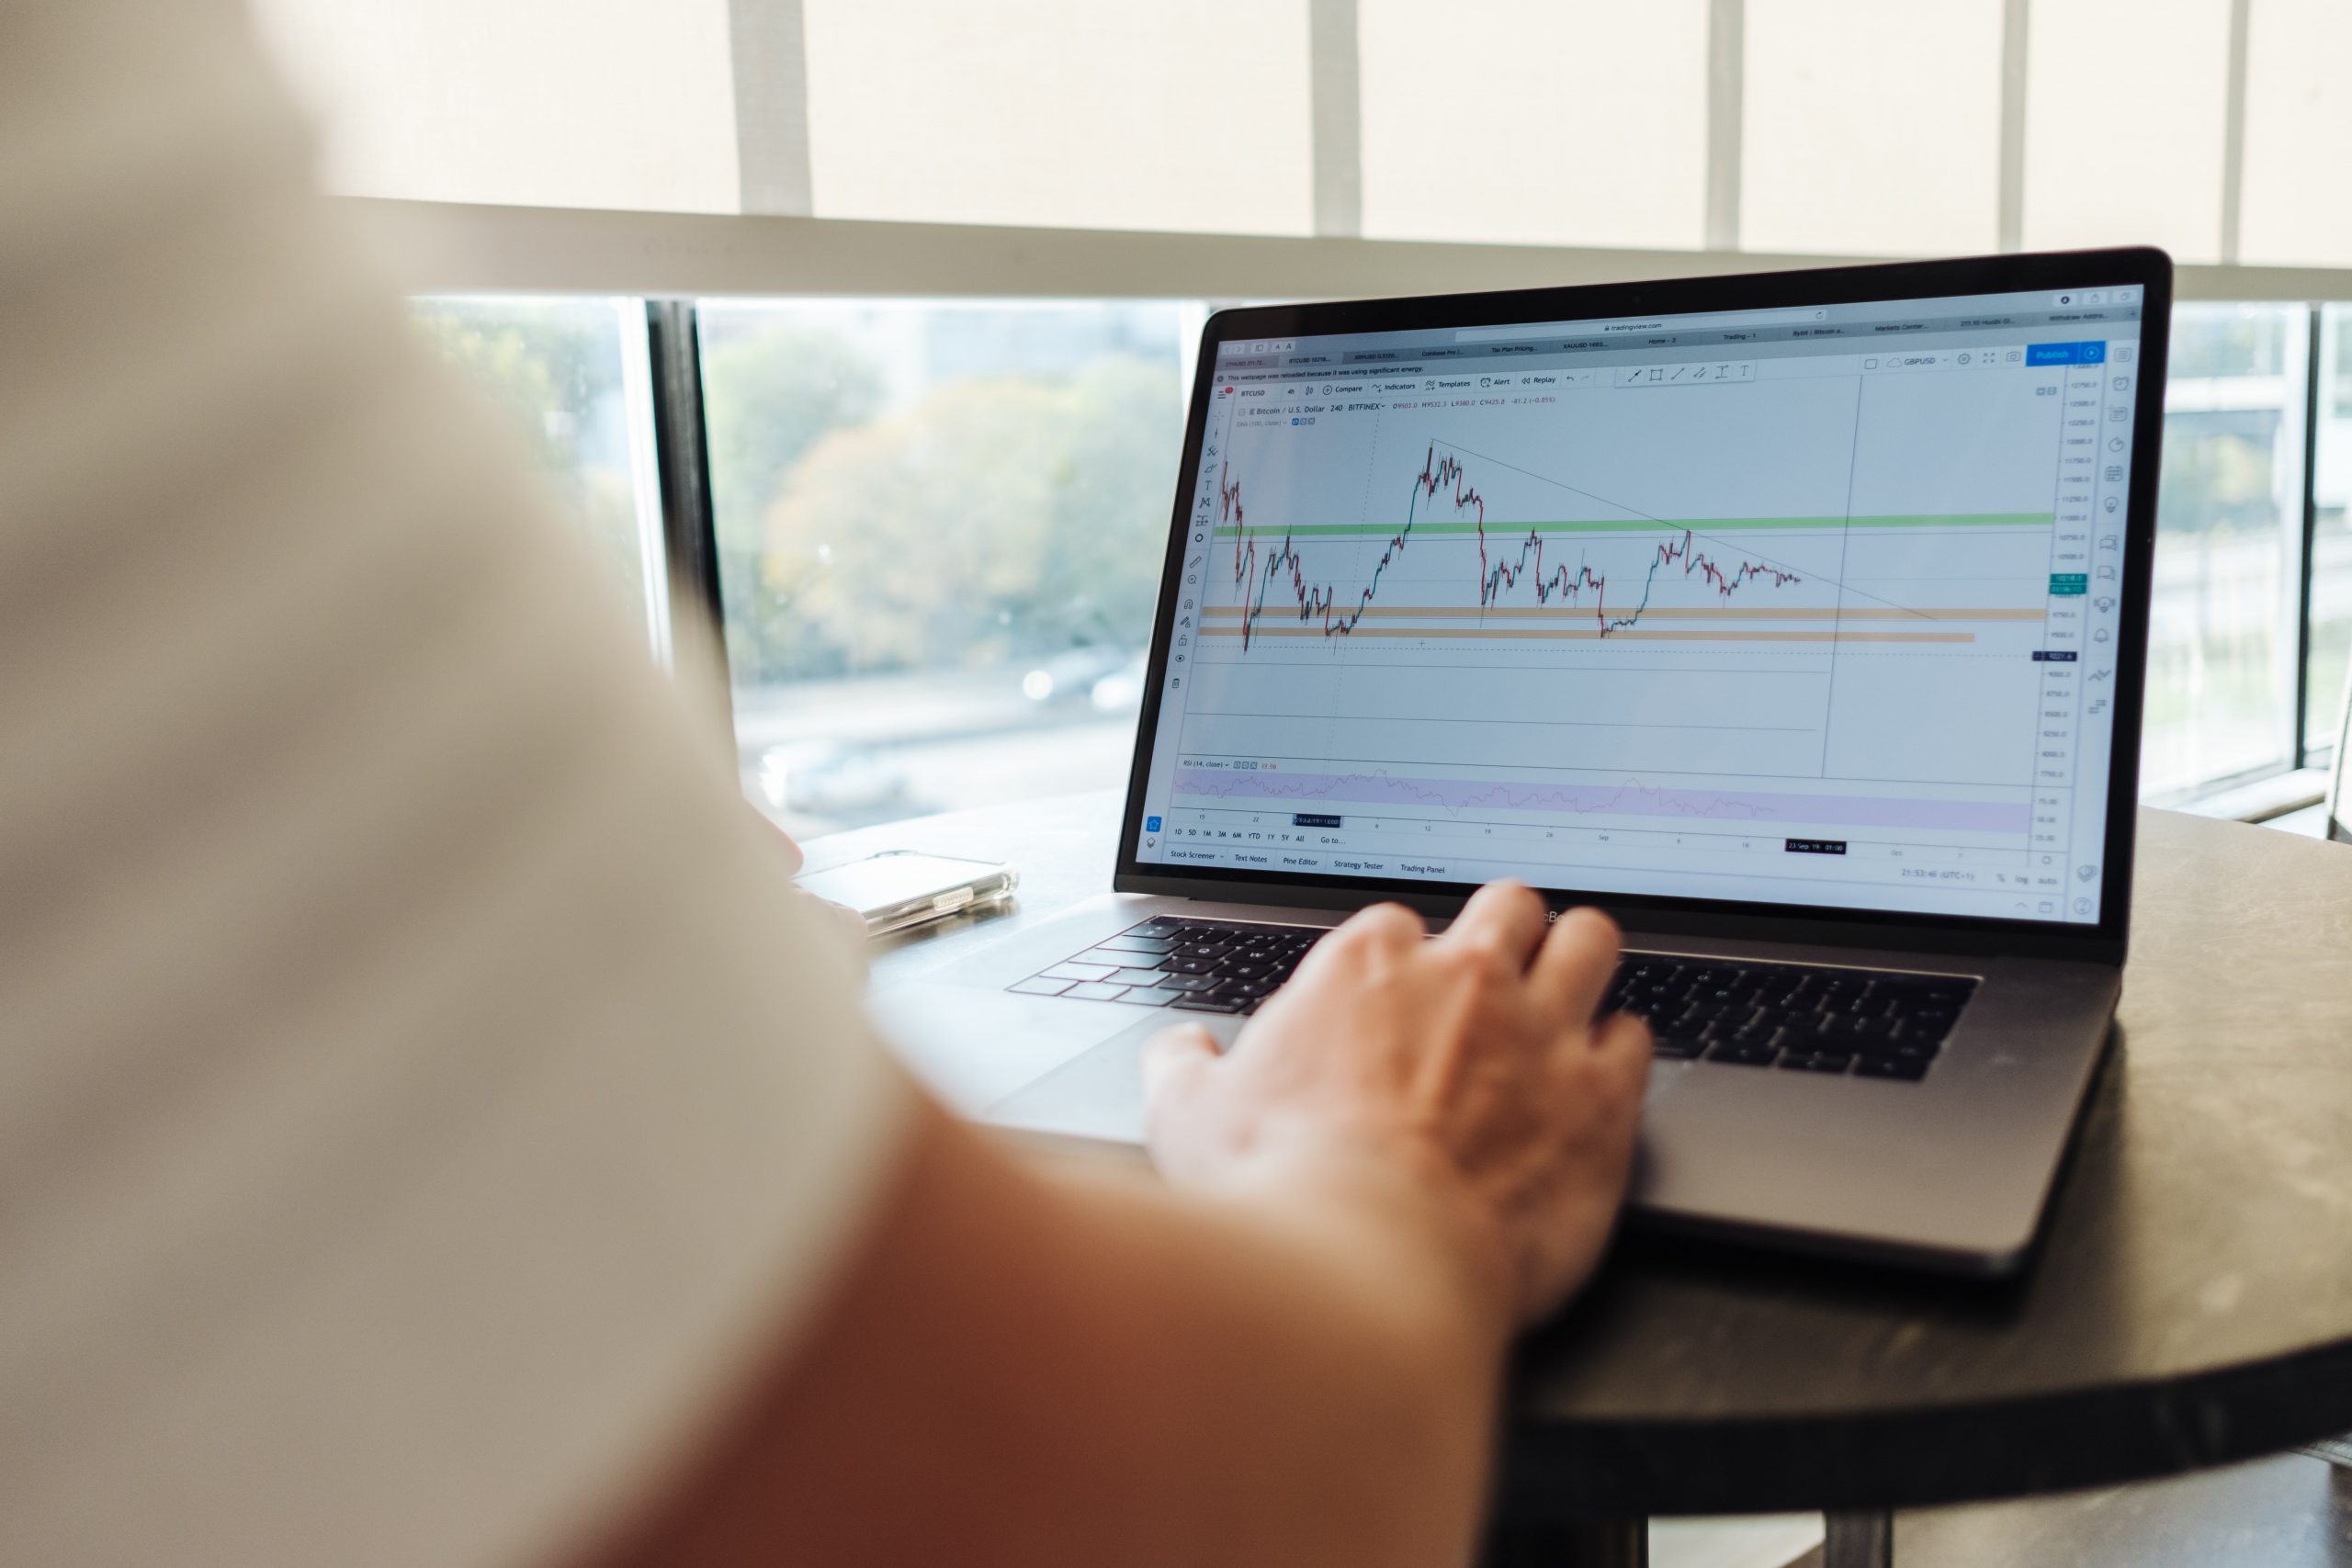
When profits are on the line and mere seconds can be the difference between a win and a loss, there’s no room for emotion or guesswork. Relying on data and patterns in the form of technical analysis is a must whether you’re day trading vs swing trading. And that’s what we are here to teach you today!
Learning how to do technical analysis of stocks empowers you to effortlessly uncover winning opportunities and execute trades to perfection, earning consistent swing trading returns.
From charts to indicators, we’re going to walk you through performing technical analysis of stocks so you can incorporate it into your own trading strategy.
But, as you’ll soon discover, there is a better way. We’ll show you how to perform technical analysis the traditional way and then show you how to analyze a stock with less time and effort using the VectorVest stock forecasting software.
That being said, let’s provide a bit of background before getting into the nitty gritty details of doing technical analysis.
Quick Overview of Technical Analysis
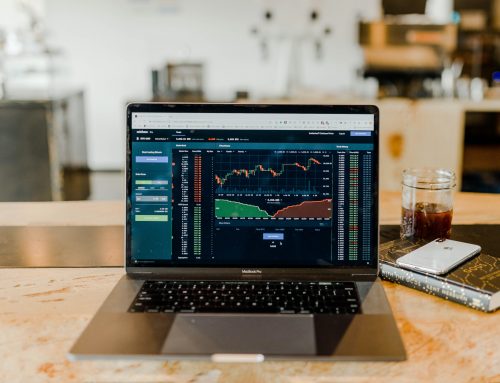
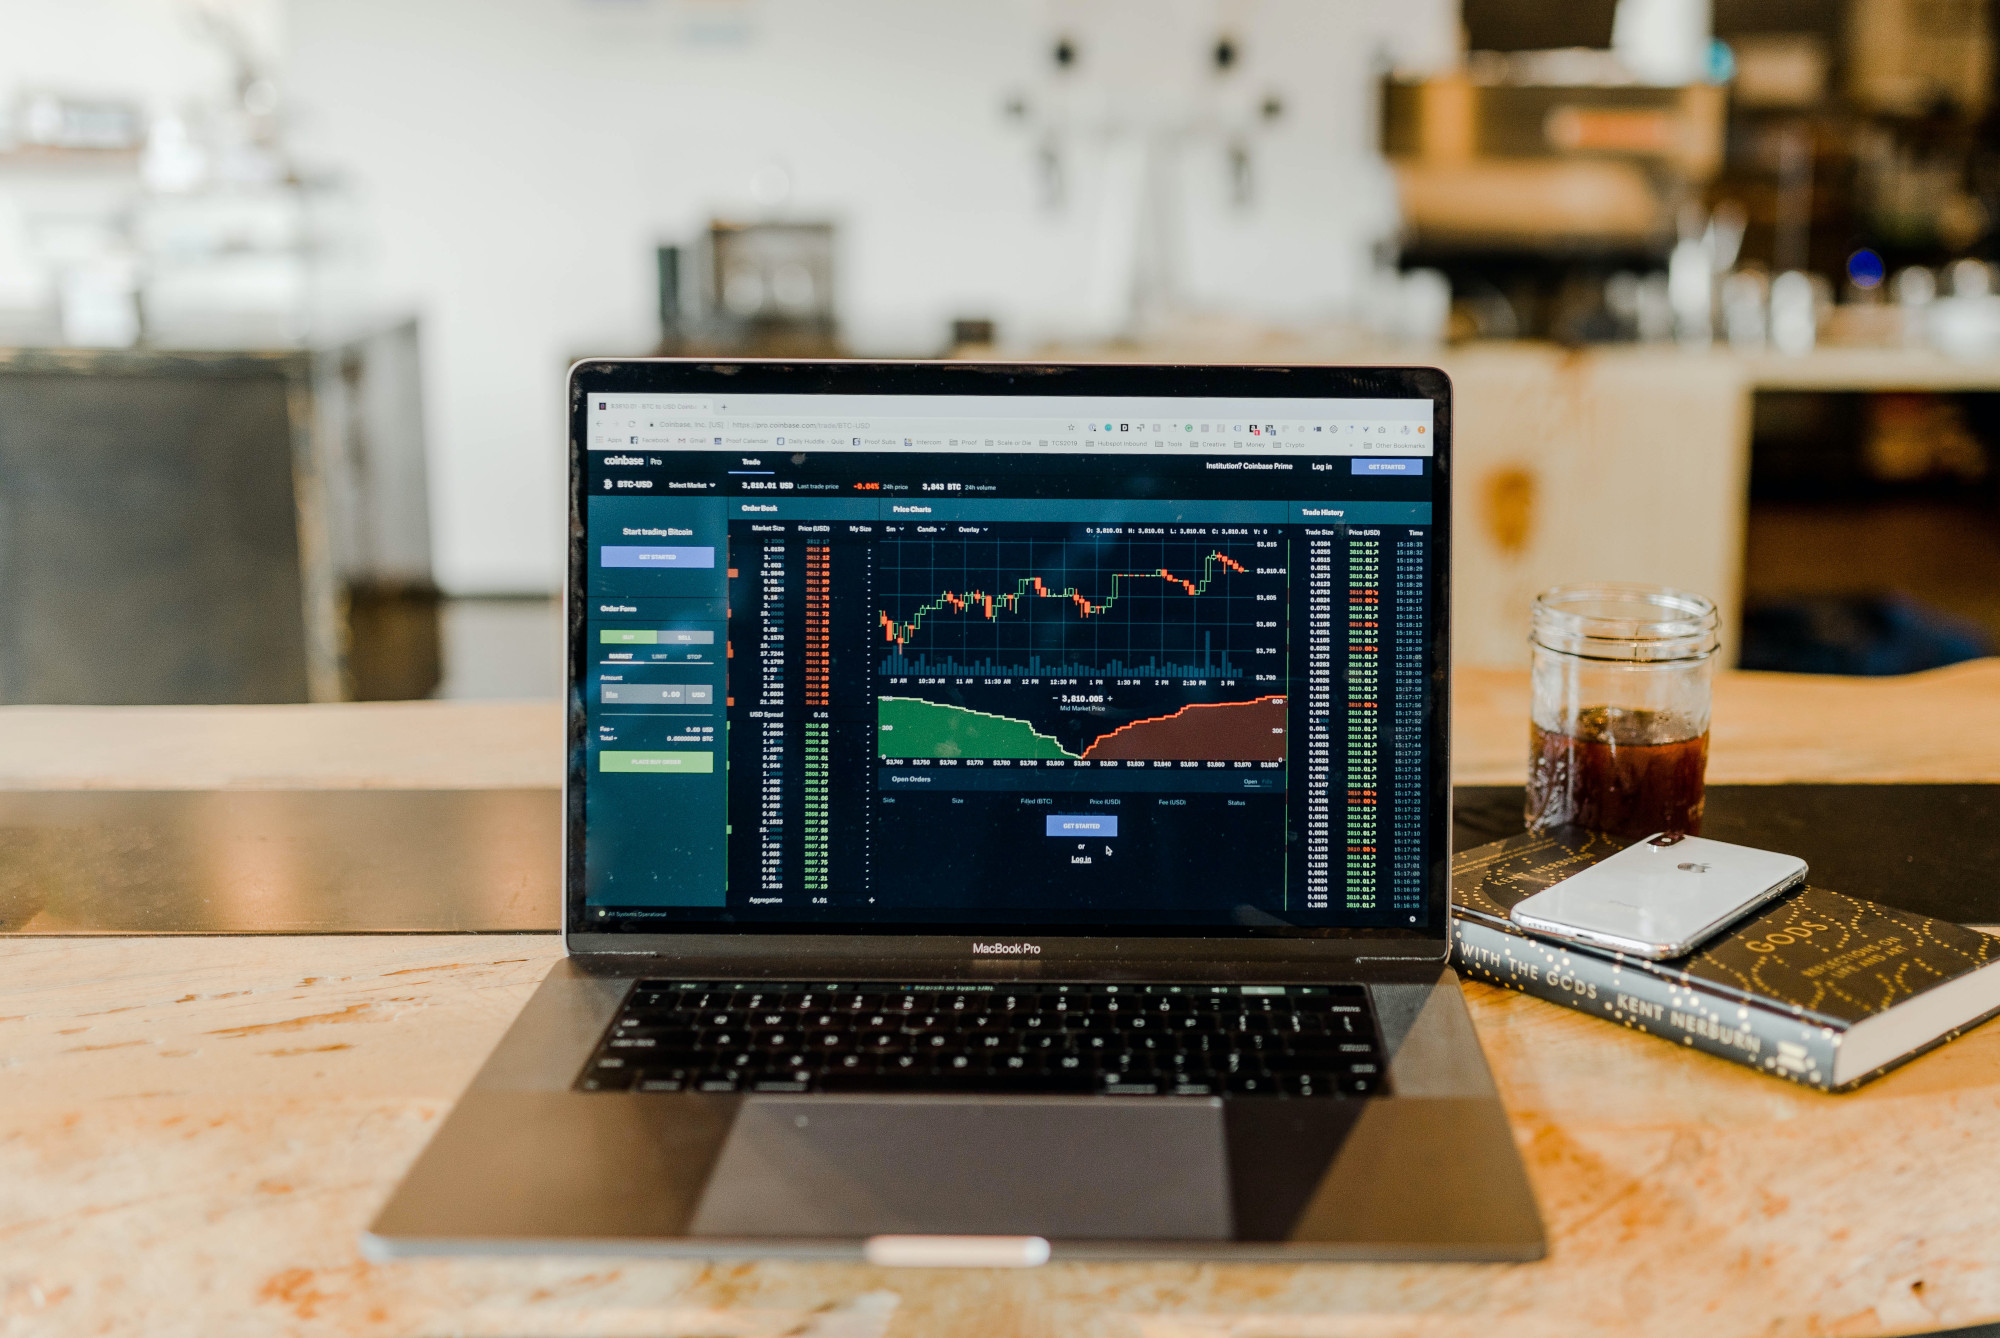
Technical analysis is a stock forecasting method that evaluates market data, primarily past prices and volumes.
At its core, this technique believes that all current market information is already reflected in the price of securities. By studying price patterns and other market indicators, traders hope to anticipate future price movements.
That being said, should you bother learning how to perform technical analysis?
Should You Learn How to Perform Technical Analysis in Your Trading Strategy?
The world of trading is as vast as it is intricate, and technical analysis is one of its most debated tools. It’s been a trusted ally for many, while others see it as just another complicated cog in the machine. So, let’s unpack the pros and cons of using technical analysis as the bedrock of your trading strategy.
Benefits of Technical Analysis
- Real-time Feedback: Technical analysis provides instantaneous insights based on current market data. It’s like having a pulse on the market’s heartbeat, helping traders make quick decisions in volatile conditions.
- Flexibility Across Markets: Whether you’re looking at stocks, forex, or commodities, technical analysis remains consistent in its approach. Its principles can be applied universally.
- Identifies Market Trends: One of the core strengths of technical analysis is its ability to identify and ride market trends, either bullish or bearish, allowing traders to position themselves for potential profits.
Shortcomings of Technical Analysis
- Learning Curve: Grasping the myriad of patterns, indicators, and their nuances can be daunting. The sheer complexity of mastering these tools can leave even seasoned traders feeling overwhelmed.
- Time-Consuming: Keeping tabs on ever-evolving charts, patterns, and indicators is a full-time job. Staying glued to screens, tracking minute changes, can not only be tedious but mentally exhausting.
- Not Always Precise: Like all tools, technical analysis is not foolproof. Markets are influenced by an array of unpredictable factors. Relying solely on past data might not always paint the complete picture.
As you dive deeper into the world of technical analysis, it’s clear that while it offers immense benefits, it’s also not devoid of challenges. The question then arises: Is there a way to harness the strengths of technical analysis without being ensnared by its complexity?
There certainly is, and it’s as simple as a subscription to the best stock analysis app the world has ever seen: VectorVest. More on that later. First, here is how to do technical analysis of stocks the old way.
How to Do Technical Analysis of Stocks: Step-by-Step Guide
Learning how to perform technical analysis might feel like navigating a maze filled with intricate patterns, volatile charts, and multifaceted indicators.
But fear not! With a systematic approach and a little dedication, you can master this art, using it to potentially turbo-charge your trading results.
Let’s embark on this step-by-step expedition together. First, you need a thorough understanding of the common charts used for analysis.
Understanding the Basics Types of Charts
Below, we’ll talk about the 3 different types of charts you can use as the foundation of your technical analysis.
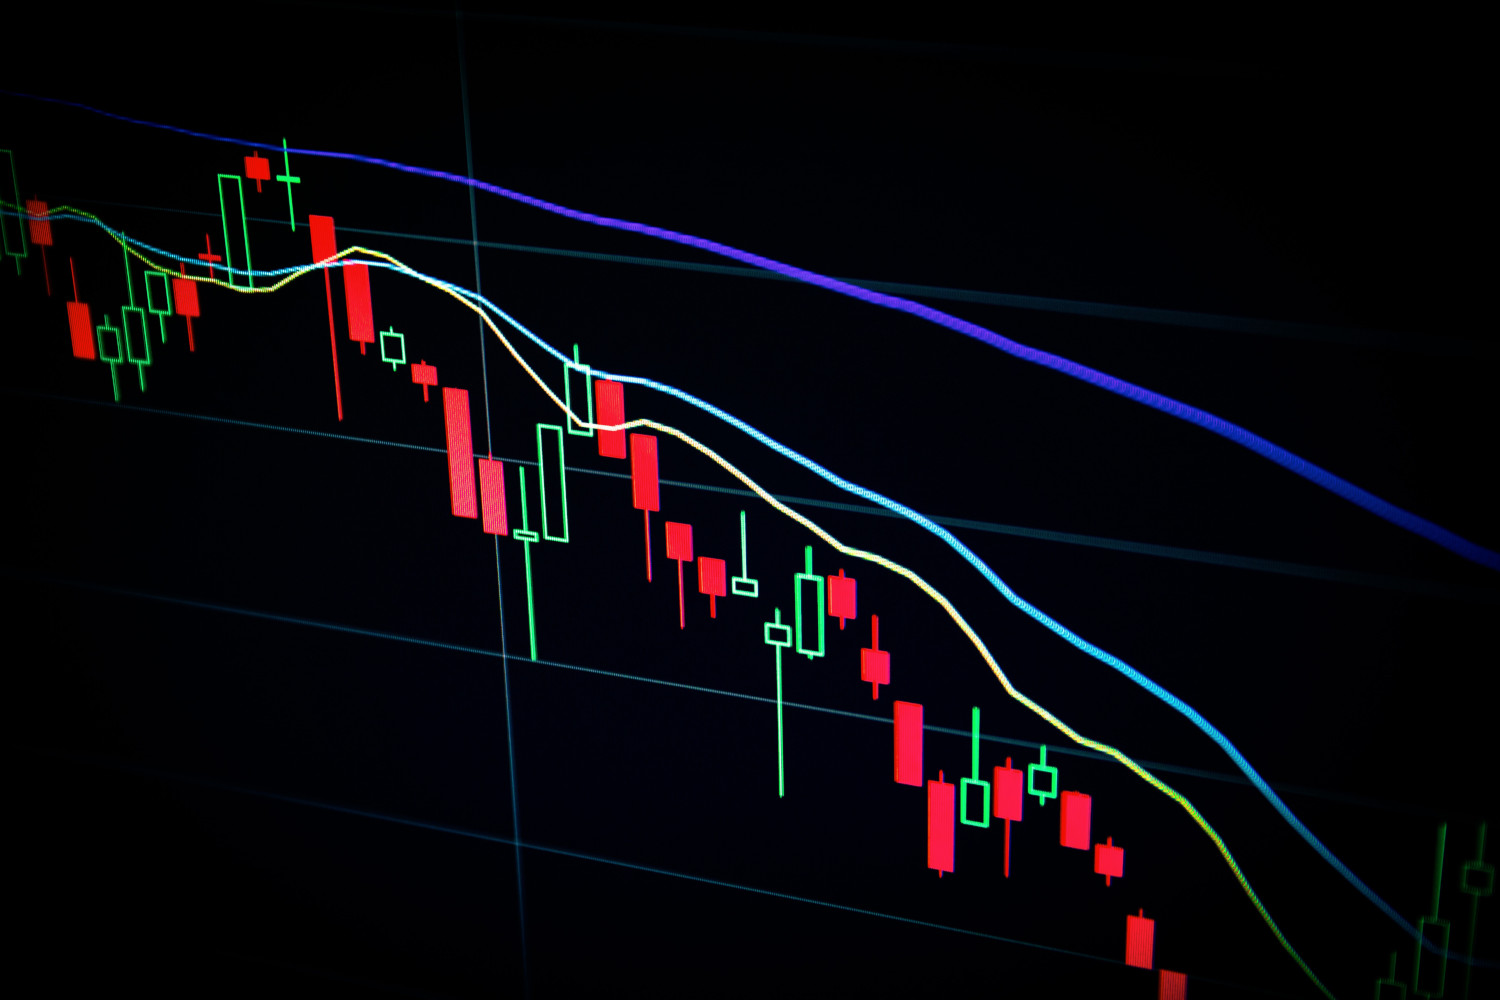
The Line Chart is the most basic form of stock charting and represents the close of each time period. The chart plots a line that connects each closing price over a specific period, which gives you a quick view of a stock’s trend over time.
While simplistic, the line chart provides clarity and can quickly highlight a stock’s general trajectory, either bullish (rising) or bearish (falling). It’s ideal for those who need a quick overview of stock performance over time, without the complexities of open, high, or low prices.
The Bar Chart goes a step further than the line chart by providing more data points about a stock’s performance. Each bar represents a single time period (a day, 3 months, etc.). The top of the bar shows the highest price for the period, and the bottom shows the lowest.
The little horizontal lines sticking out of either side represent the opening price (on the left) and the closing price (on the right).
This chart helps traders visualize the range of movement for each period, providing insight into volatility and potential trend reversals. As such, it’s best for traders looking to gauge the volatility of a stock and want more information than a simple line chart.
Last, but certainly not least, we have the Candlestick Chart – the preferred choice among most modern traders. Like bar charts, candlesticks represent the open, high, low, and close.
If the stock closes higher than its opening price, a hollow (often white or green) rectangle forms (called the body). If the stock closes lower than its opening price, a filled (often black or red) rectangle forms.
The little lines sticking out from the top and bottom are known as wicks or shadows, indicating the high and low prices of the period.
Beyond just price, candlestick patterns can show momentum, market sentiment, and potential reversals. Patterns like the Doji, Bullish Engulfing, and Bearish Shooting Star can indicate future price movements.
Traders who want to combine price data with market psychology can benefit from using candlestick charts. These are also ideal for spotting short-term price patterns and potential reversals.
Selecting and Interpreting Key Technical Indicators
Whether you’re looking for the best indicators for swing trading or day trading, you’ll first hear of moving averages. And for good reason.
The Simple Moving Average (SMA) calculates the average stock price over a specific period. For instance, a 50-day SMA will average out the closing prices over the last 50 days. If the stock price moves above its SMA, it might indicate a bullish trend.
Then you have the Exponential Moving Average (EMA), which is a more dynamic version of the SMA. It gives more importance to recent price data, making it more responsive to price changes in the more recent term.
In using either of these indicators, look for crossovers. When a short-term MA crosses above a long-term MA, it’s a bullish sign. The opposite crossover is a bearish sign.
Relative Strength Index (RSI) is another way to get a sense of how a stock’s price is moving. It measures the speed and change of price movements and operates on a scale of 0 to 100. Generally, an RSI above 70 indicates an asset is overbought, while an RSI under 30 indicates the asset may be oversold.
The Moving Average Convergence Divergence (MACD) is a unique indicator that consists of 3 distinct parts: the MACD line, the signal line, and the MACD histogram.
The MACD line represents the difference between two EMAs, while the signal line is an EMA of the MACD line. A bullish signal occurs when the MACD line crosses above the signal line. A bearish signal is when it crosses below.
You should also be able to use Bollinger Bands, which consists of an SMA and two standard deviation lines. These bands expand and contract based on market volatility, giving you insights into when a stock is poised to run one way or the other.
When stock prices touch the upper band, it may be overextended and due for a pullback. When they touch the lower band, the stock might be undervalued.
Fibonacci Retracements are horizontal lines representing potential support and resistance levels based on the Fibonacci sequence. After a significant price movement, watch if the stock price retraces to, and then bounces off, one of these levels.
Now, there are many other indicators you can use as you perform technical analysis but these will be your best bet for keeping things simple and ensuring you gain all the insights you need. You may not need to use all of them, but you should be able to at least!
Pattern Recognition for Profitable Trading
Patterns offer traders hints about the possible future movements of stock prices. The sheer number of swing trading patterns might seem overwhelming at first. But once you’re familiar with a few key ones, you’ll begin to spot them everywhere.
For example, Head and Shoulders is a reversal pattern. An uptrend followed by a smaller peak, then a larger one, and another smaller one can signal a reversal from bullish to bearish. You’ll know it’s time to sell when the price drops below the neckline (the lowest point between the two smaller peaks).
Another reversal pattern worth watching for is Double Top and Double Bottom. A double top indicates a reversal from an uptrend to a downtrend, while a double bottom suggests the opposite. For a double top, sell when the price drops below the lowest point between the peaks. For a double bottom, buy when the price rises above the highest point between the troughs.
Triangle Patterns can be ascending, descending, or symmetrical, and they often signify a period of consolidation before a breakout. Buy or sell based on the direction of the breakout from the triangle.
Volume Analysis: Assessing Market Strength
Volume gives a voice to the stock’s price movement, indicating the strength or weakness of a trend. There are 3 telltale signs here to watch for that will help you determine when to buy stocks and when to sell stocks.
- Increasing Volume with Rising Price: This is a bullish sign. It means that the upward movement has strong backing, and there’s a good chance it might continue.
- Increasing Volume with Falling Price: This is a bearish signal, indicating that a downward trend might continue.
- Decreasing Volume: A sign of uncertainty. Traders are undecided, and this often happens during consolidations.
Always confirm price movements with volume. A price increase without significant volume might not sustain, but if it’s backed by high volume, it has more weight. We have an incredible market timing indicator that can do this for you – more on that later.
Setting Up Stock Screeners to Find Winning Opportunities on Autopilot
If you’ve ever wondered how to find stocks to swing trade on any given day, screeners are the answer.
These are like your personal scouts in the market jungle, filtering through the noise to find gems that meet your criteria. They bring the best stocks to swing trade, day trade, or short (depending on what your strategy is) at any given time.
Most stock analysis platforms allow you to build your own screeners. Choose parameters that match your strategy, such as P/E ratios, market cap, RSI levels, and more. Once you’ve set your criteria, the screener will provide a list of stocks that meet them.
But remember, while screeners are powerful, they’re just a starting point. Always conduct further analysis to confirm the opportunity before actually entering your position.
Using Technical Analysis to Set Stop-Loss and Take-Profit Points
Before you even enter your position, you should have used technical analysis to map out your entry and exit points based on positive and negative scenarios.
Better yet, you should have set up trading stops that cut losses when necessary and take profits when they’re there. This eliminates emotion and human error from getting in the way of your success.
It’s common to set a stop-loss at a recent support level because if the stock falls below this, it might continue to drop. Similarly, you can set take profit orders at recent resistance levels. If the stock has struggled to rise above a certain price in the past, it might face challenges again.
Want to Simplify Your Approach to Stock Analysis to Win More Trades With Less Work?
There you have it – how to do technical analysis of stocks using charts, indicators, patterns, and more. While this approach is tried and true, it’s not without its shortcomings.
It takes a ton of time to do this day in and day out, which can leave you feeling shackled to your screen. What’s more, it invites the possibility of human error, guesswork, and more from interfering with your profit potential.
Sometimes, an overload of information can lead to paralysis by analysis. As you dive deeper into technical patterns, indicators, and volume assessments, you might start to wonder: Is there a streamlined way to tackle stock analysis without compromising on accuracy?
Introducing the VectorVest Stock Forecasting Software
At the crossroads of sophistication and simplicity lies VectorVest. Born out of the need to bridge intuitive design with the cutting-edge demands of stock forecasting, VectorVest is the best swing trading platform available.
While most platforms may scratch the surface, VectorVest delves deep, assessing over 20,000 stocks daily. But instead of overwhelming you with complex data, it synthesizes this vast information and distills it into actionable insights.
Time is of the essence in stock trading. VectorVest’s predictive algorithms adjust to market dynamics, offering you not just a snapshot of the present, but a foresight into potential future trends. This forward-thinking approach can be the difference between catching a rising star stock or missing the boat entirely.
The system has called every major market move since the Dot Com Bubble and has outperformed the S&P 500 by 10x over that span. That being said, here is how to perform technical analysis using VectorVest instead of traditional tactics.
How to Perform Technical Analysis Quickly and Easily Using Our System
VectorVest’s strength lies in its simple proprietary stock-rating system. Let’s demystify how this powerhouse operates:
- Relative Value (RV): Instead of getting lost in a labyrinth of numbers, RV gives you a clear answer on a stock’s long-term price appreciation potential compared to other securities or a benchmark like a treasury bond. It’s a direct reflection of the perceived value of a stock for the long haul.
- Relative Safety (RS): In turbulent market waters, you want to know if your stock can stay afloat. RS is your buoyancy check. It assesses the consistency and predictability of a company’s financial performance. In simpler terms, it’s a risk measure — the higher the RS, the safer the bet.
- Relative Timing (RT): Trading is as much about ‘when’ as it is about ‘what’. RT gives you a pulse on a stock’s short-term price trend. An RT score above 1 indicates an uptrend, and vice versa. It’s the trader’s compass, always pointing to the stock’s current momentum.
When assessing a potential trade, imagine RV, RS, and RT as three pillars of a strong foundation. A stock with a high RV might be a great long-term investment, but if its RT is plummeting, it might not be the best buy for the moment. By juxtaposing these ratings, you can make decisions that are both timely and strategic.
But, it gets even easier – because the system issues a clear buy, sell, or hold recommendation for any given stock at any given time based on these ratings.
Don’t just take our word for it, get a free stock analysis and discover what our desktop or mobile stock advisory app can do for you! Because at this point, it’s time to wrap up this guide on how to do technical analysis of stocks and let you put what you’ve learned into practice.
Wrapping Up Our Guide on How to Do Technical Analysis of Stocks
There you have it – how to perform technical analysis. From understanding the nuances of various chart types, decoding key technical indicators, to recognizing profitable patterns and setting up automated screeners, we’ve unveiled the layered world of technical analysis.
Yet, as we’ve highlighted, while traditional methods have their merits, the future of stock analysis lies in embracing technology and innovation. VectorVest stands as a beacon in this evolution, offering an intersection of simplicity, depth, and foresight.
Whether you’re implementing market timing strategies or swing trading strategies, regardless of if you’re a position trader or scalper, VectorVest can help you win more trades with less work. Why do technical analysis the hard, time-consuming way if you don’t have to?
Learn more about trading in our blog. We have guides on topics like what is swing trading, swing trading for beginners, best time frame for swing trading, buying the dip,
market sentiment indicators, buying and selling stocks same day, and more.
As you step forward in your trading journey, remember: knowledge is your compass, and tools like VectorVest are your North Star. If you’re ready to redefine your trading game, set up your VectorVest subscription today and elevate your stock analysis to unparalleled heights!


Leave A Comment