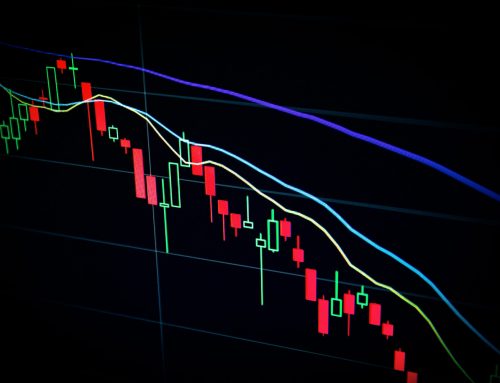
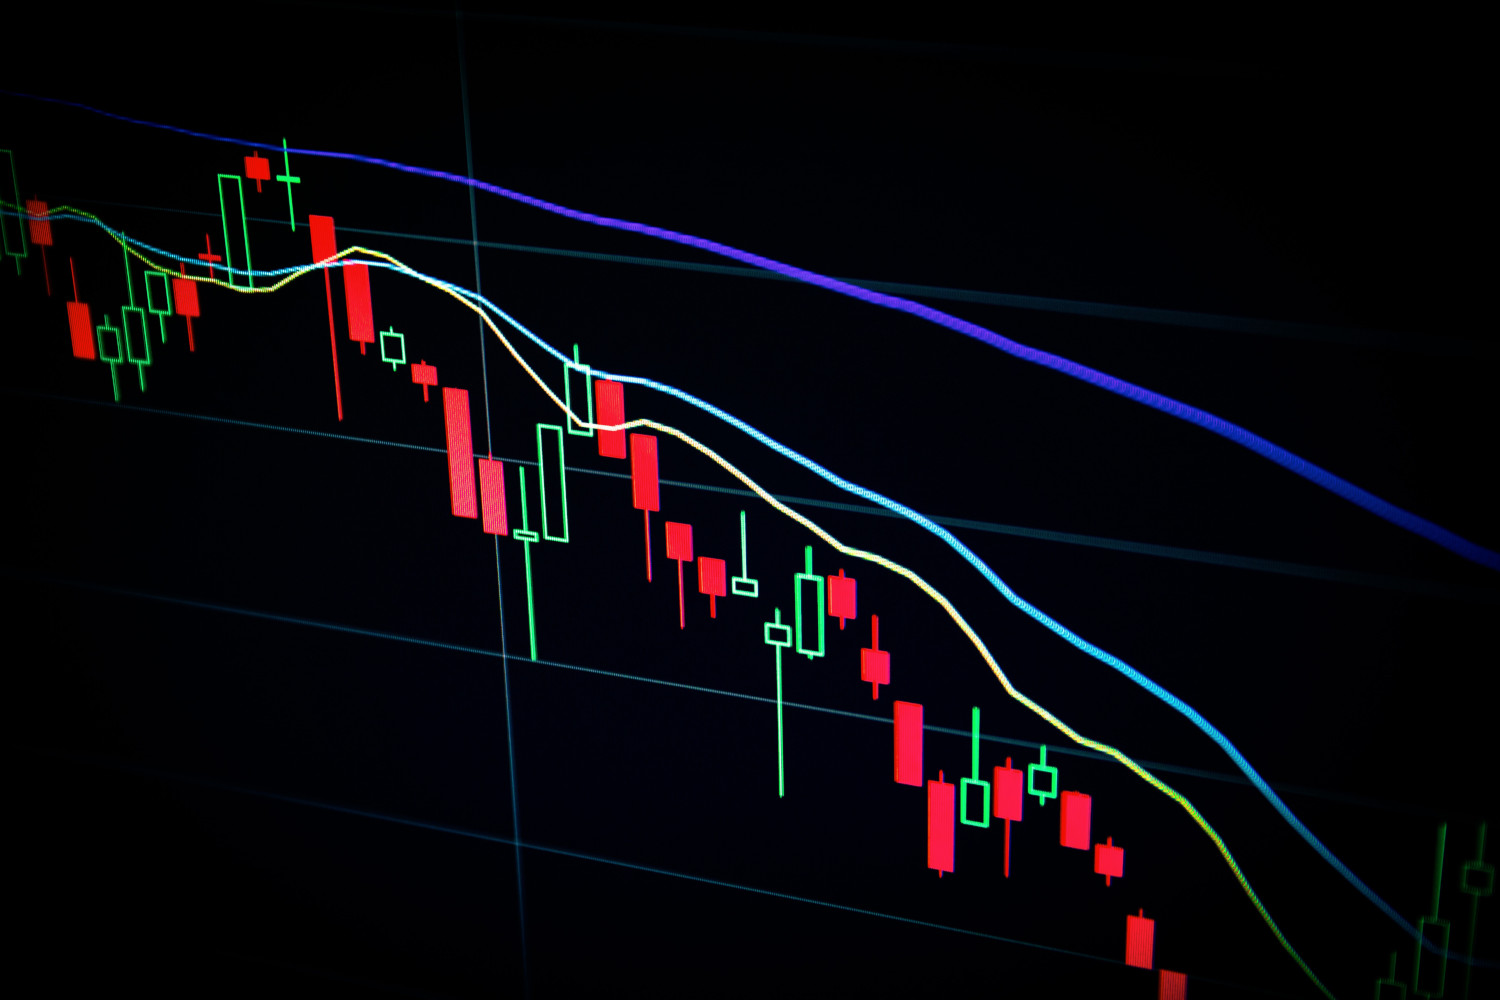
Trading indicators offer insights into market trends, price movements, and potential investment opportunities. You can think of technical stock indicators as your map on a road trip – they help inform your decision-making, empowering you to execute consistently profitable trades.
However, understanding which indicators to use and how to interpret them becomes crucial with an array of stock market technical indicators available. So, what are the best technical indicators for stock trading – and how do you go about using them?
We’ll cover all this and more below. But more importantly, we’ll also introduce the VectorVest system for those seeking a more straightforward approach. After all, technical trading indicators can be quite complex and leave you feeling shackled to your screen all day.
Our comprehensive stock analysis software is designed to simplify your trading experience by consolidating various analyses into clear ratings. It’s going to transform the way you trade. That being said, let’s start off with a quick introduction to what technical stock indicators are in the first place.
What Are Stock Market Technical Indicators?
Stock market technical indicators are mathematical calculations based on the price, volume, or open interest of a security. These indicators are primarily used to forecast financial market direction, aiding traders and investors in making more informed decisions.
Definition and Purpose
Trading indicators serve to interpret stock price movement and help delineate where the market might be headed next. They act as a visual guide, providing clarity and insights that might not be immediately apparent from looking at a stock’s raw price action alone.
The ultimate goal of using these indicators is to identify potential buying and selling points, reduce the impact of market noise, and mitigate the risks associated with volatility.
Types of Technical Analysis Indicators
Stock indicators come in various forms, each serving a unique purpose and providing different insights:
- Trend Indicators: These indicators help to ascertain the overall direction of the market. Moving Averages and MACD (Moving Average Convergence Divergence) are prominent examples.
- Momentum Indicators: They identify the speed at which prices are changing. This category includes the RSI (Relative Strength Index) and Stochastic Oscillator.
- Volatility Indicators: These indicators reflect the size and scope of price fluctuations, with Bollinger Bands and Average True Range (ATR) being well-known variants.
- Volume Indicators: They help understand the strength of a price move based on the levels of trade volume. Examples include the On-Balance Volume (OBV) and Chaikin Money Flow.
So, why do you need to know about the various technical stock indicators for the stock market? What can these help you do?
How Stock Technical Indicators Empower Your Trading Decisions
Stock trading indicators are your guide to navigating the market whether you’re day trading vs swing trading, position trading, scalping, or even swing trading options or swing trading ETFs. Here’s what they do for you…
Identifying Trends and Reversals
Technical stock indicators excel in deciphering market trends, highlighting whether an asset is in an uptrend, downtrend, or moving sideways.
Moving Averages, for instance, smooth out price action, making it easier to identify the prevailing trend. When prices deviate significantly from these averages, it could signal a potential reversal.
The MACD indicator is another pivotal tool that assists in spotting trend reversals through crossovers, divergence, and rapid rises or falls. We’ll provide more context on these types of indicators shortly.
Gauging Market Sentiment
Market sentiment indicators like the Relative Strength Index (RSI) and Stochastic Oscillator are crucial for understanding market sentiment. They help traders gauge whether a stock is overbought or oversold by measuring the velocity and magnitude of price movements.
An RSI reading above 70, for example, suggests that an asset might be overvalued and due for a pullback, while a reading below 30 indicates potential undervaluation.
Providing Buy and Sell Signals
Stock indicators generate specific signals that guide traders on when to buy stocks and when to sell a stock for profit.
Bollinger Bands, for example, create a price channel that adapts to volatility. When the price touches the upper band, it may be time to sell or go short, while a touch of the lower band might signal a buying opportunity.
Volume indicators like On-Balance Volume (OBV) provide additional confirmation, as rising volume confirms an ongoing trend, while falling volume might presage a reversal.
The Best Technical Indicators for Stock Trading (and How to Use Them)
You now know that technical analysis indicators provide you with the necessary clarity to make informed decisions. So, let’s get into the best technical indicators for stock trading below and empower you to use them as part of your market timing strategies!
Moving Averages (SMA and EMA)
As we mentioned earlier, these indicators make it easier for you to ascertain the prevailing trend behind a stock. They can be categorized as either EMAs and SMAs:
- Simple Moving Average (SMA): SMA calculates the average stock price over a specific period, offering a smooth line that helps identify the trend direction. Traders often use two SMAs with different timeframes to generate signals; a shorter SMA crossing above a longer SMA indicates a potential buy signal, while the opposite suggests a sell.
- Exponential Moving Average (EMA): EMA gives more weight to recent prices, responding more quickly to price changes than SMA. It’s particularly useful for short-term trading, helping identify trend reversals and price targets swiftly.
Our guide to the best EMAs for swing trading is a great resource to learn more about these trading indicators. But, let’s look at one of the most profound moving average indicators – the MACD.
Moving Average Convergence Divergence (MACD)
MACD is perhaps the best indicator for swing trading. It’s a trend-following momentum indicator that consists of two moving averages.
The MACD line (difference between the 12-day and 26-day EMA) and the signal line (9-day EMA of the MACD) interact to produce trading signals.
A MACD line crossing above the signal line suggests a bullish trend, prompting a buy signal, whereas a cross below signals a potential sell.
Traders also watch for divergence between MACD and stock prices as a sign of upcoming reversals.
Bollinger Bands
Bollinger Bands comprise a middle band being an N-period simple moving average (SMA), an upper band at K times an N-period standard deviation above the middle band, and a lower band at K times an N-period standard deviation below the middle band.
They adjust with volatility, narrowing during less volatile periods and widening during high volatility. Prices tend to bounce within the bands, and when the price breaks the bands, it may signal a continuation or a reversal, depending on prevailing trends.
Relative Strength Index (RSI)
RSI measures the speed and change of price movements, oscillating between zero and 100. The RSI is considered overbought when above 70 and oversold when below 30.
Traders use RSI to identify the general trend, overbought and oversold conditions, and potential buy or sell signals. A divergence between RSI and price may indicate a potential reversal.
Stochastic Oscillator
This momentum indicator compares a particular closing price of a stock to a range of its prices over a certain period of time, with the sensitivity of the oscillator to market movements adjustable by changing that time period or by taking a moving average of the result.
The stochastic oscillator is range-bound, meaning it is always between 0 and 100. This makes it useful for identifying overbought and oversold conditions. A reading above 80 generally indicates overbought conditions, while a reading below 20 indicates oversold conditions.
Fibonacci Retracement
This tool is based on the idea that markets will retrace a predictable portion of a move, after which they will continue to move in the original direction.
Traders use Fibonacci Retracement to identify potential reversal levels on charts. Horizontal lines are drawn at the classic Fibonacci levels of 23.6%, 38.2%, 50%, 61.8%, and 100% to identify possible support and resistance levels.
How to Combine Technical Stock Indicators for Enhanced Accuracy
While the various trading indicators each have their place, you won’t need to use all of them for every trade. That being said, how do you go about combining the right stock market technical indicators for your trading strategy?
Utilizing a Mix of Trend-Following and Momentum Indicators
Combine trend-following technical stock indicators like moving averages with momentum indicators like MACD.
When a short-term moving average crosses above a long-term moving average, it may signal an upward trend. This can be confirmed if MACD is above the signal line and moving upwards. Conversely, downward trends can be identified and confirmed in a similar manner.
There are other ways you can use trend/momentum indicators in tandem too – such as pairing Bollinger Bands with RSI.
Bollinger bands can help you understand the market’s volatility and price levels. When the price hits the upper band, look at the RSI to see if it’s above 70, indicating overbought conditions.
If both align, it might be time to consider selling. Similarly, if the price hits the lower band and RSI is below 30, it might indicate a buying opportunity.
Fine-Tuning Entries and Exits with Oscillators and Support/Resistance
Use the Stochastic Oscillator to identify potential reversal points by looking for divergences and overbought/oversold conditions.
Combine this with Fibonacci Retracement levels to find strong support or resistance areas, helping you to pinpoint more accurate entry and exit points.
Cross-Verification to Avoid False Signals
Always ensure that the signals from one indicator are confirmed by another. For example, if MACD shows a bullish crossover but RSI is indicating overbought conditions, it may be prudent to wait for further confirmation or reevaluate the trade.
Utilize different time frames to confirm trends and signals. A signal might look strong on a short time frame but could be contradicted when looking at a longer time frame. Our guide on the best time frame for swing trading can help you navigate this uncertainty.
The Challenge of Constantly Relying on Technical Stock Indicators
There’s no denying the role of stock technical indicators in your trading strategy. That being said, there are a few challenges that come from relying on these trading indicators to inform your decision-making…
The Risk of Overcomplication
Traders can find themselves overwhelmed analyzing endless charts and signals – leading to “analysis paralysis”. This overcomplication causes indecision, delaying crucial trading decisions and potentially missing out on profitable opportunities.
Plus, different technical indicators can sometimes provide contradictory signals. For example, while moving averages may indicate a strong uptrend, RSI could be suggesting overbought conditions. Navigating these discrepancies requires experience and a well-thought-out trading strategy.
Balancing Technical Analysis with Other Market Insights
Successful trading demands a balanced approach, integrating both fundamental vs technical analysis.
While technical indicators help in understanding market movements and identifying potential trade opportunities, fundamental analysis provides insights into a company’s health, industry trends, and broader economic factors. Our guide on how to do fundamental analysis of stocks is a great resource on this subject.
That being said, you also need to understand the prevailing mood of market participants – AKA market sentiment. This can add a valuable layer to your analysis.
Indicators can show what’s happening, but interpreting why it’s happening often requires considering news, reports, and broader market sentiment.
The Time Commitment
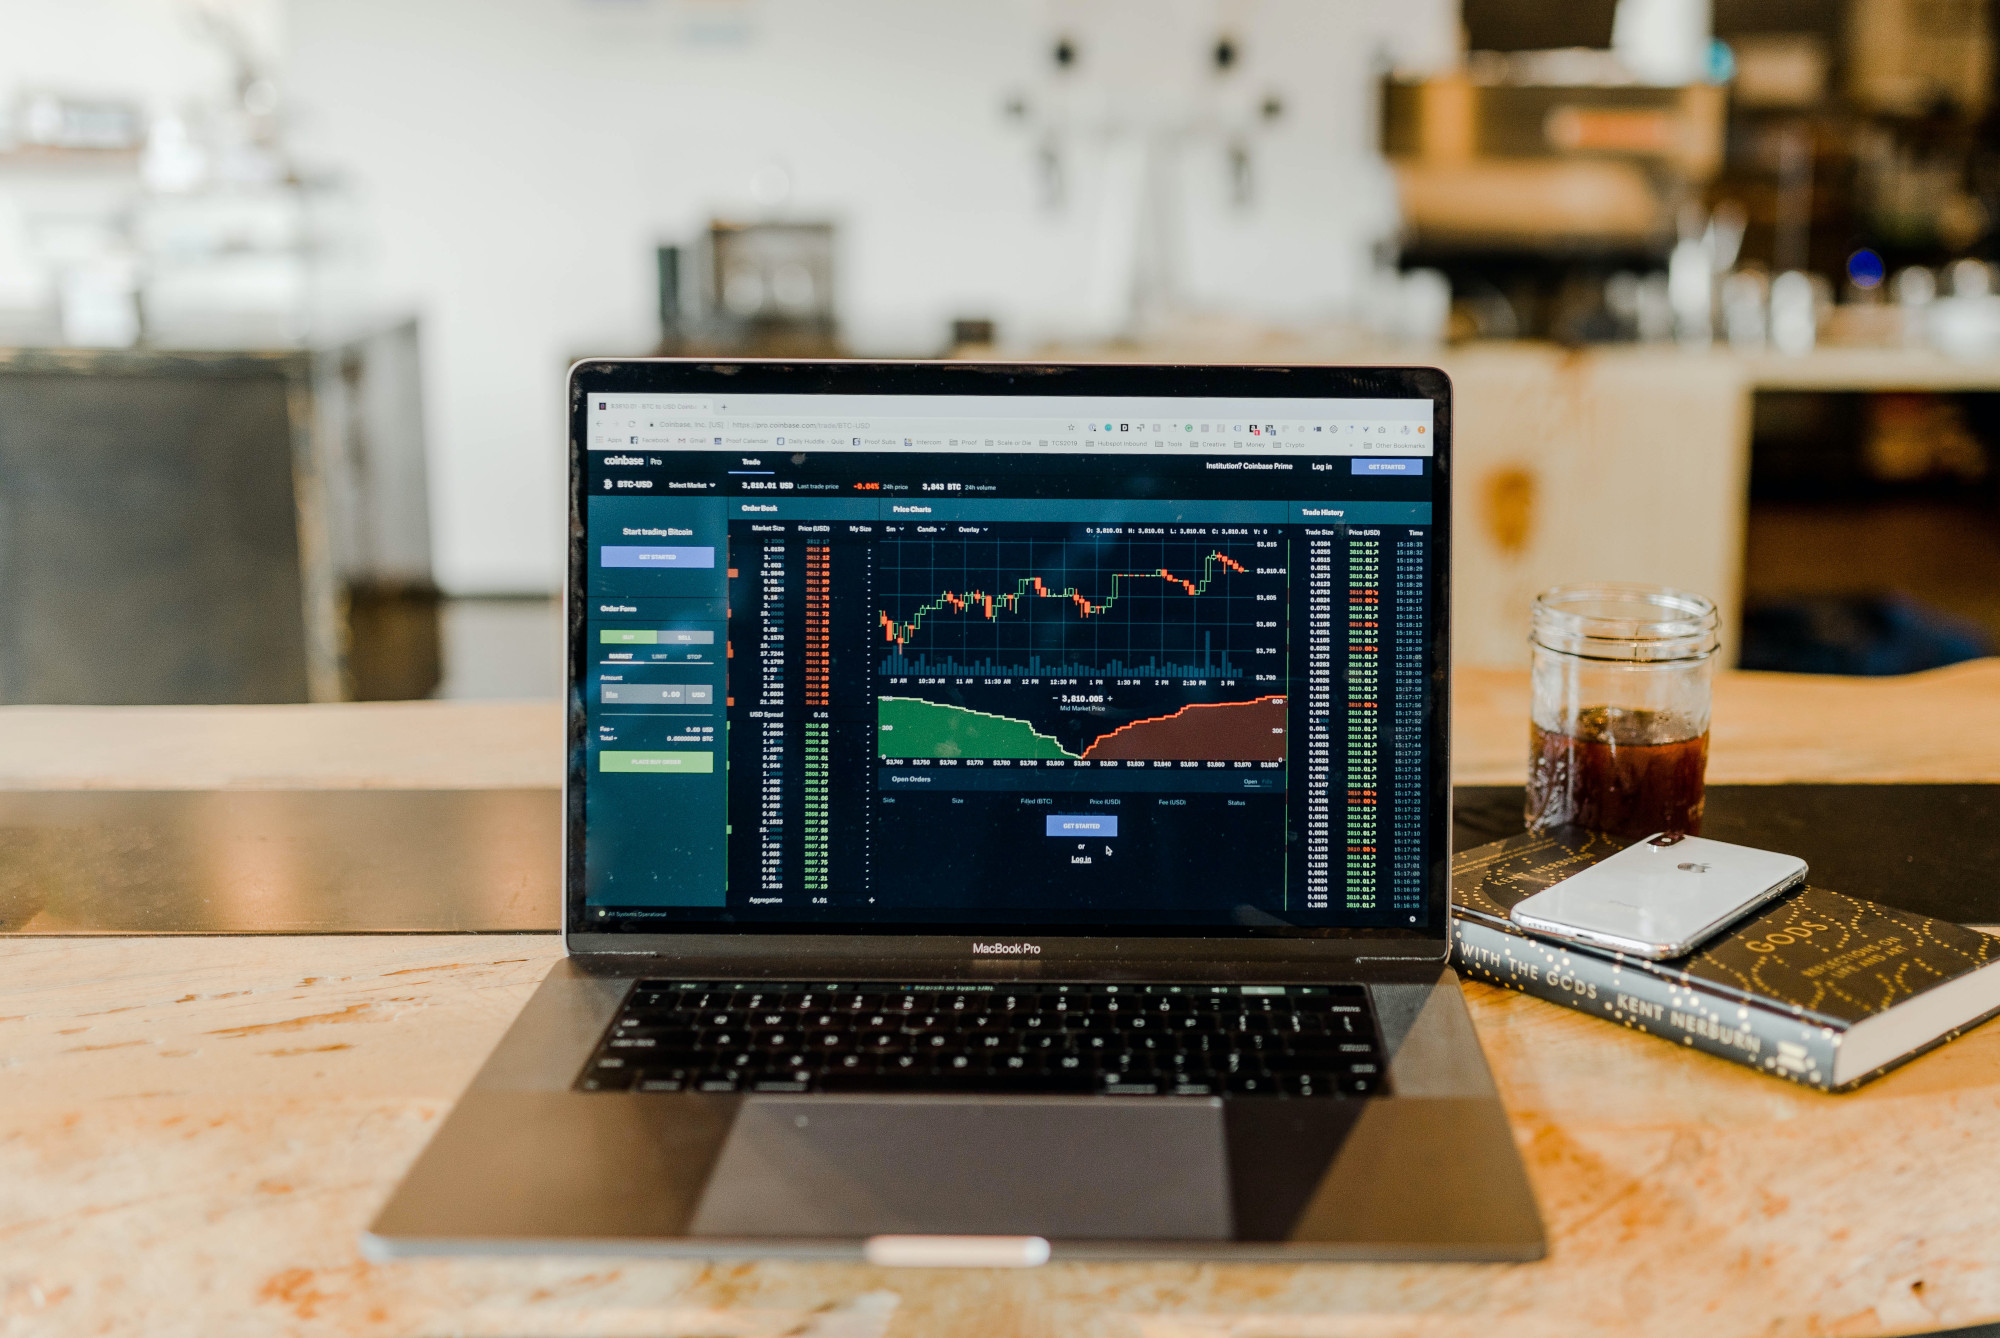
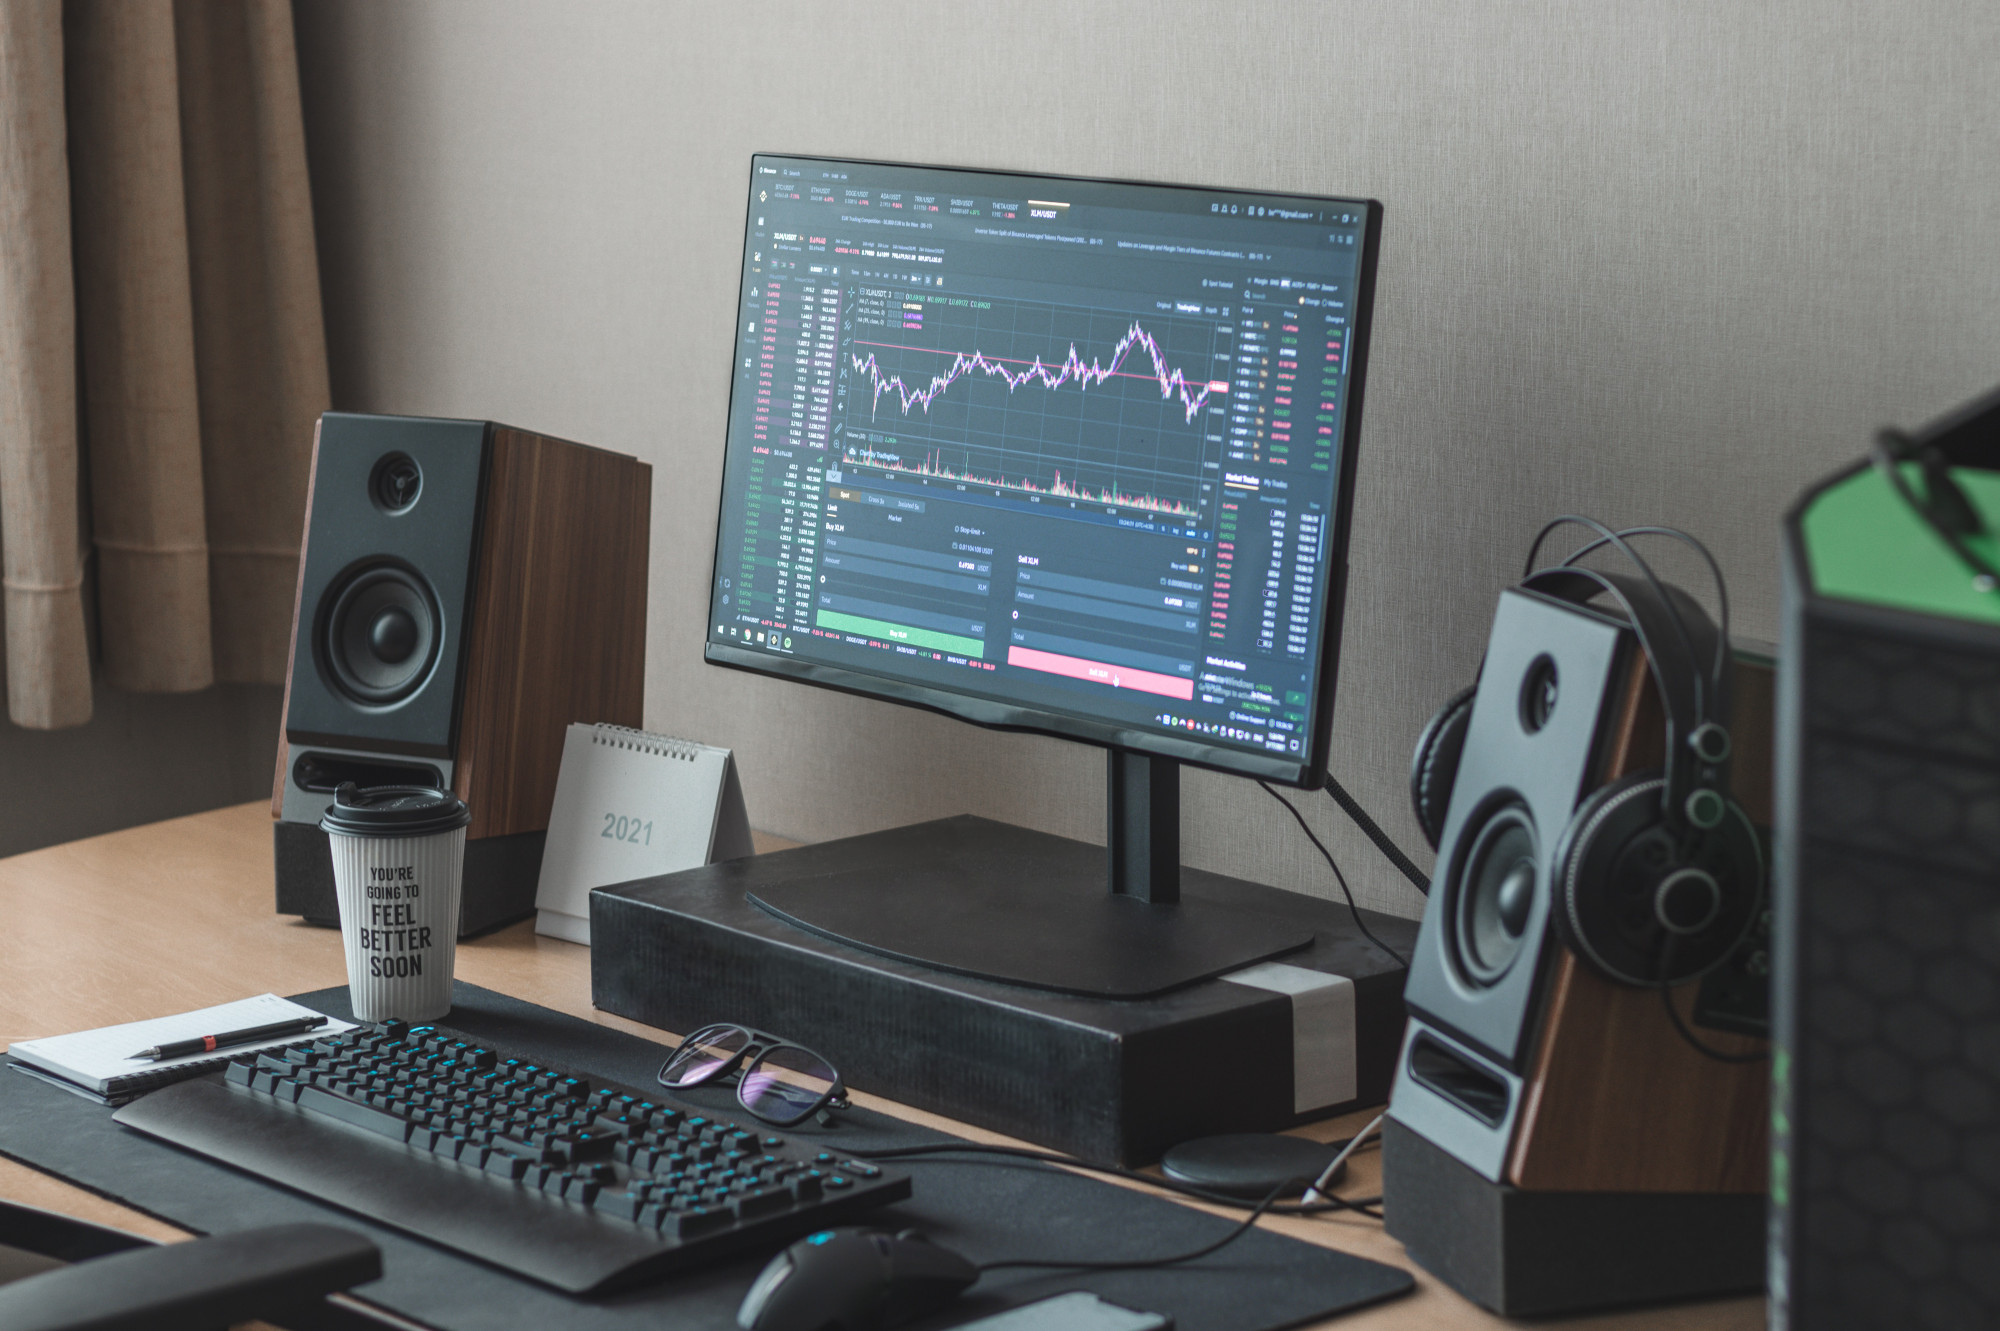
The biggest issue with stock trading indicators? They leave you feeling shackled to your screen. Tracking and interpreting these indicators isn’t just perplexing at times, it’s time-consuming.
Traditional traders who use technical analysis indicators find themselves at their desks from before market open to long after market close, trying to make sense of the various stock market technical indicators we’ve described today.
But, there’s a good chance you’re here because you want to learn about swing trading for beginners. This raises another concern – mastering technical analysis indicators takes time.
New traders must be prepared to invest substantial hours in learning, practicing, and refining their skills before expecting consistent results.
As we explain in our guide on how to learn swing trading, you’re better off investing in technology that can tune out the noise and uncover swing trading patterns for you…that’s where VectorVest comes in.
How to Make Clear, Calculated Investment Decisions Without the Complexity of Technical Stock Trading Indicators
Learning how to analyze stocks is important, but the truth is you don’t have to go about it the traditional way. These days, you can leverage the best stock analysis app the world has ever seen: VectorVest.
The system simplifies your trading strategy by giving you clear, actionable insights on what you should do with any given stock at any given time. It consolidates all the complex technical trading indicators into 3 simple ratings: relative value (RV), relative safety (RS), and relative timing (RT).
Each sits on its own scale of 0.00-2.00, with 1.00 being the average. This allows for quick and easy interpretation – saving you time and stress while empowering you to win more trades with less work. In fact, you’re given a clear buy, sell, or hold recommendation based on these ratings!
The system is considered the best swing trading platform as it’s outperformed the S&P 500 index by 10x over the past 20 years and counting. It can empower you to do the same – whether you’re struggling with uncovering the best stocks to swing trade or the best beginner stocks.
Wouldn’t it be nice to worry less about how to find stocks to swing trade and where to buy the dip? You can see how our stock advisory works firsthand with a free stock analysis today. That being said, it’s time we left you with a few closing thoughts on the best technical stock indicators.
Closing Thoughts on the Best Technical Stock Trading Indicators
From Moving Averages to the Stochastic Oscillator, MACD to Bollinger Bands, there are countless technical stock indicators you have at your disposal to help you find opportunities and execute upon them.
That being said, it’s crucial to use stock market technical indicators with a grain of salt. And, in this day and age when simpler, more foolproof methods of stock analysis exist, why waste your time and take on undue financial stress?
You can gain more swing trader tips in our blog. We cover the swing trading basics like learning technical analysis, how to pick a stock, the pros and cons of swing trading, what is a swing trade, realistic swing trading returns, what happens to the stock market during a recession, the best time of day to buy stocks, investing in a down market, and more.
The VectorVest system distills various technical trading indicators into clear ratings, empowering you to make informed decisions confidently. Start with VectorVest today, and trade smarter, not harder.

Leave A Comment