Fine-tuning your MACD settings offers a clearer path to profitable trades. But what are the best MACD settings for swing trading – and how do you actually go about using this swing trade indicator?
This guide on how to use MACD for swing trading will leave you feeling confident and clear about harnessing the power this indicator has to offer. No matter what conditions you’re trading in there is a way you can adjust your settings to gain meaningful insights and execute trades with conviction.
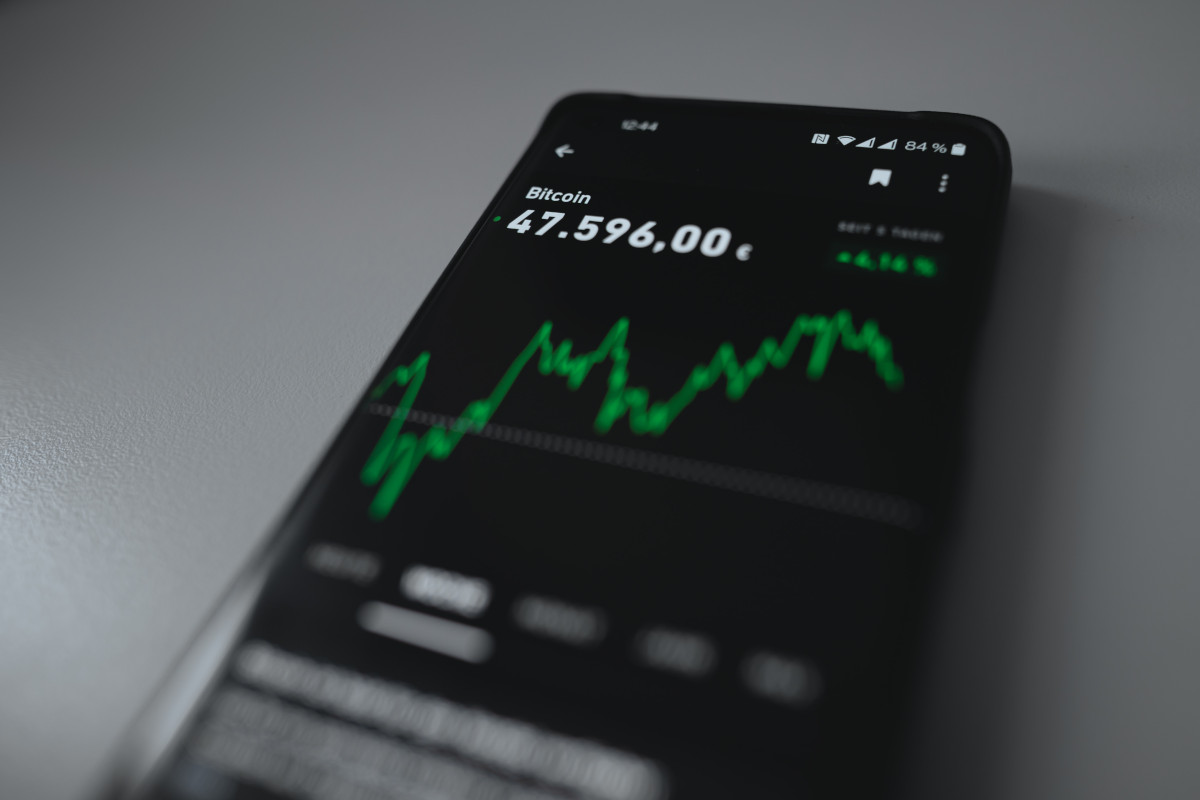
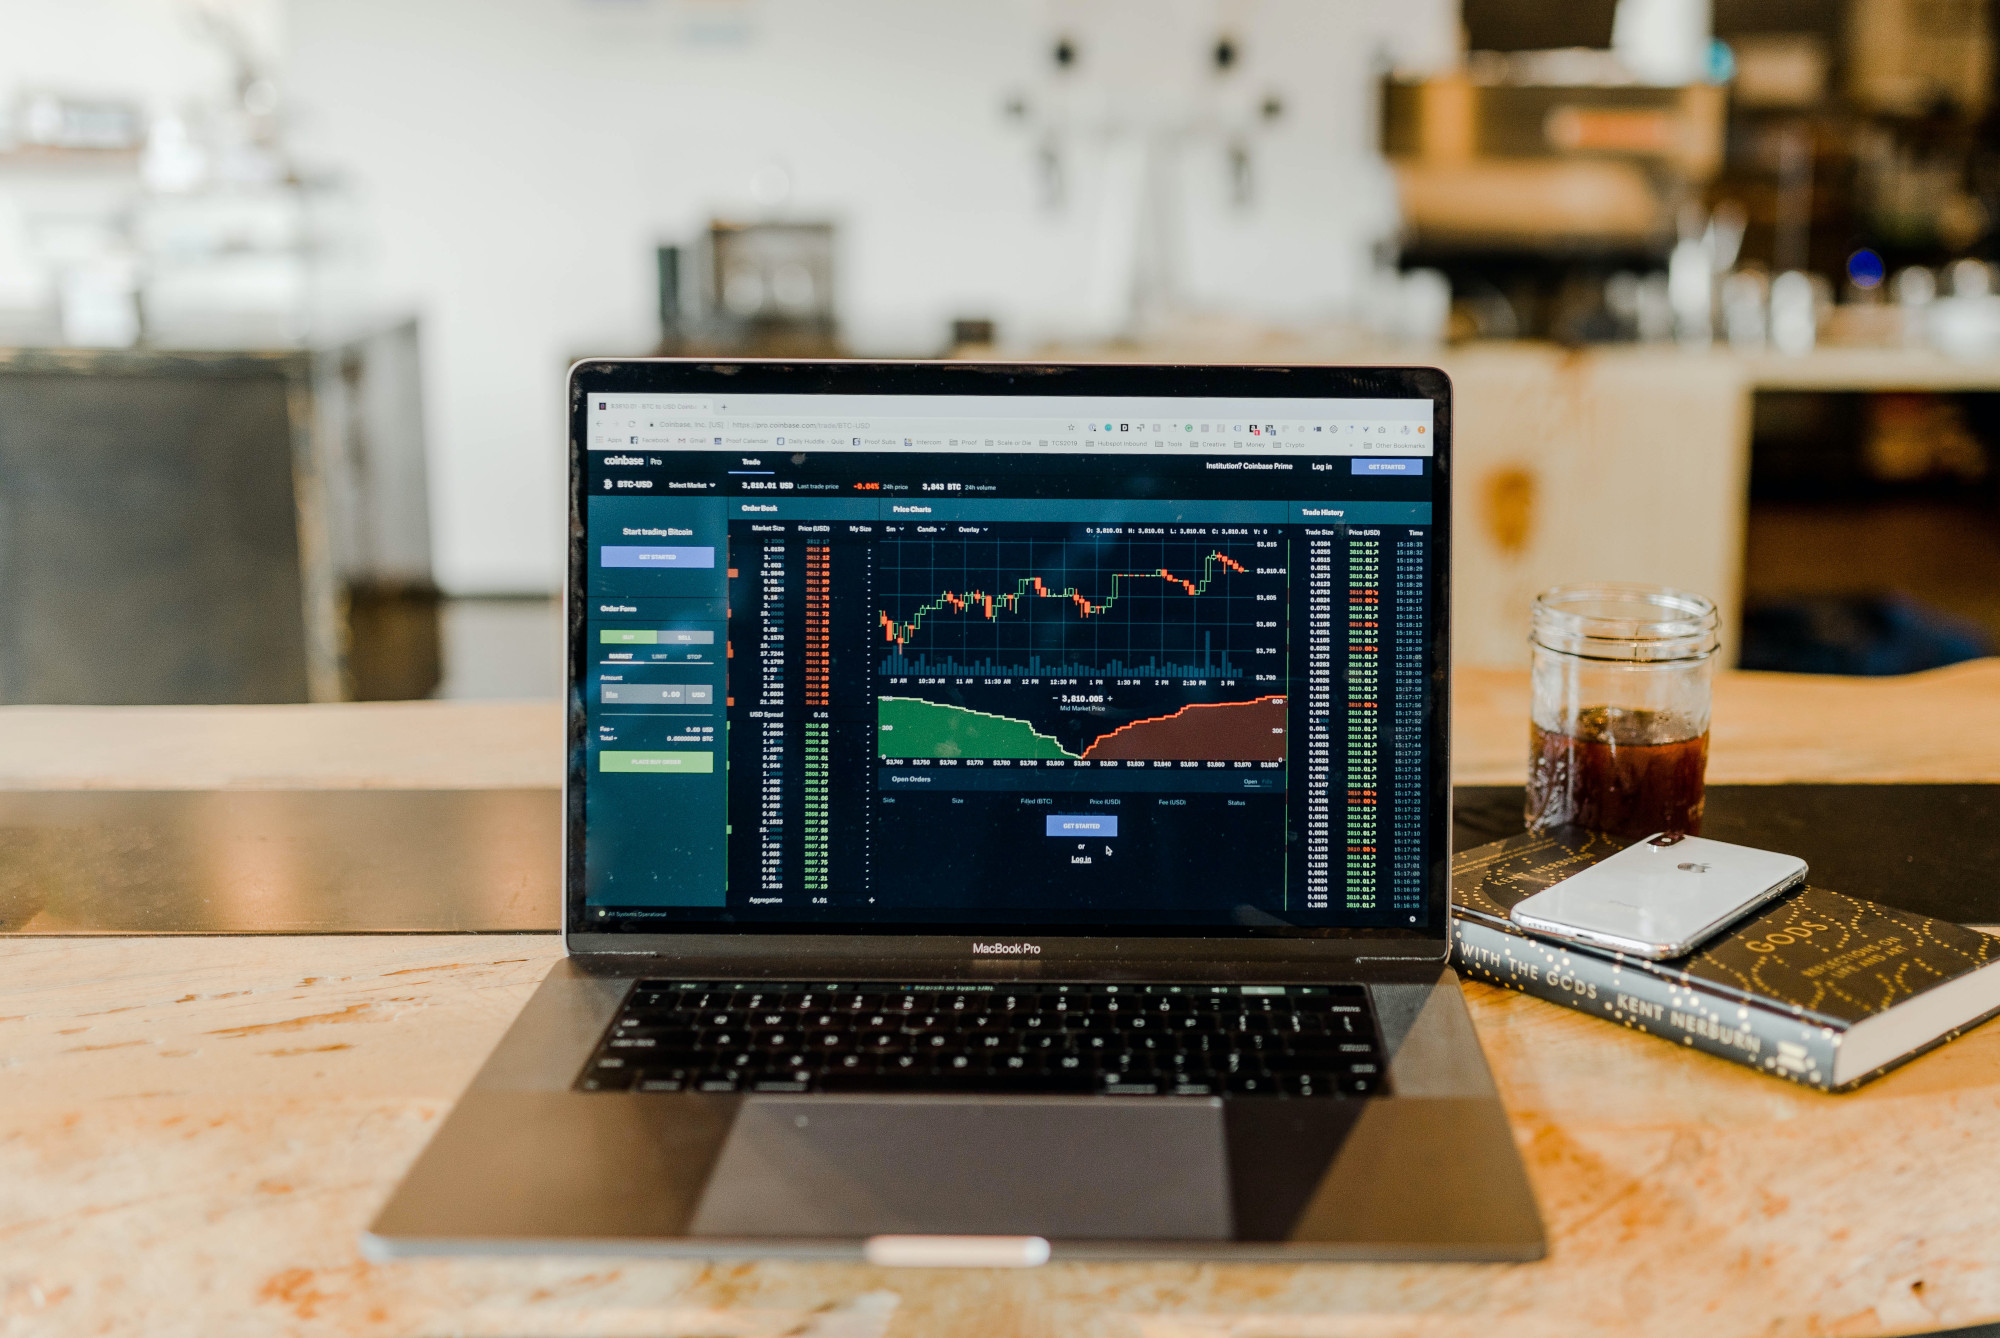
That being said, MACD settings can get pretty complex and may even offer false signals from time to time. That’s why we recommend you save yourself time and stress by using the stock analysis software awaiting you at VectorVest.
We help investors simplify their trading strategies while winning more trades. VectorVest has outperformed the S&P 500 index by 10x over the past 20 years and counting. See what a difference the best swing trading alert service can make in your investment strategy today!
What is MACD (Moving Average Convergence Divergence)?
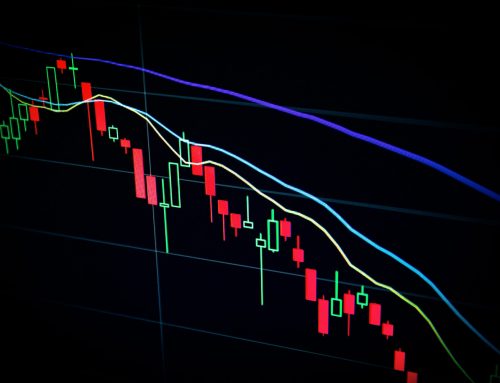
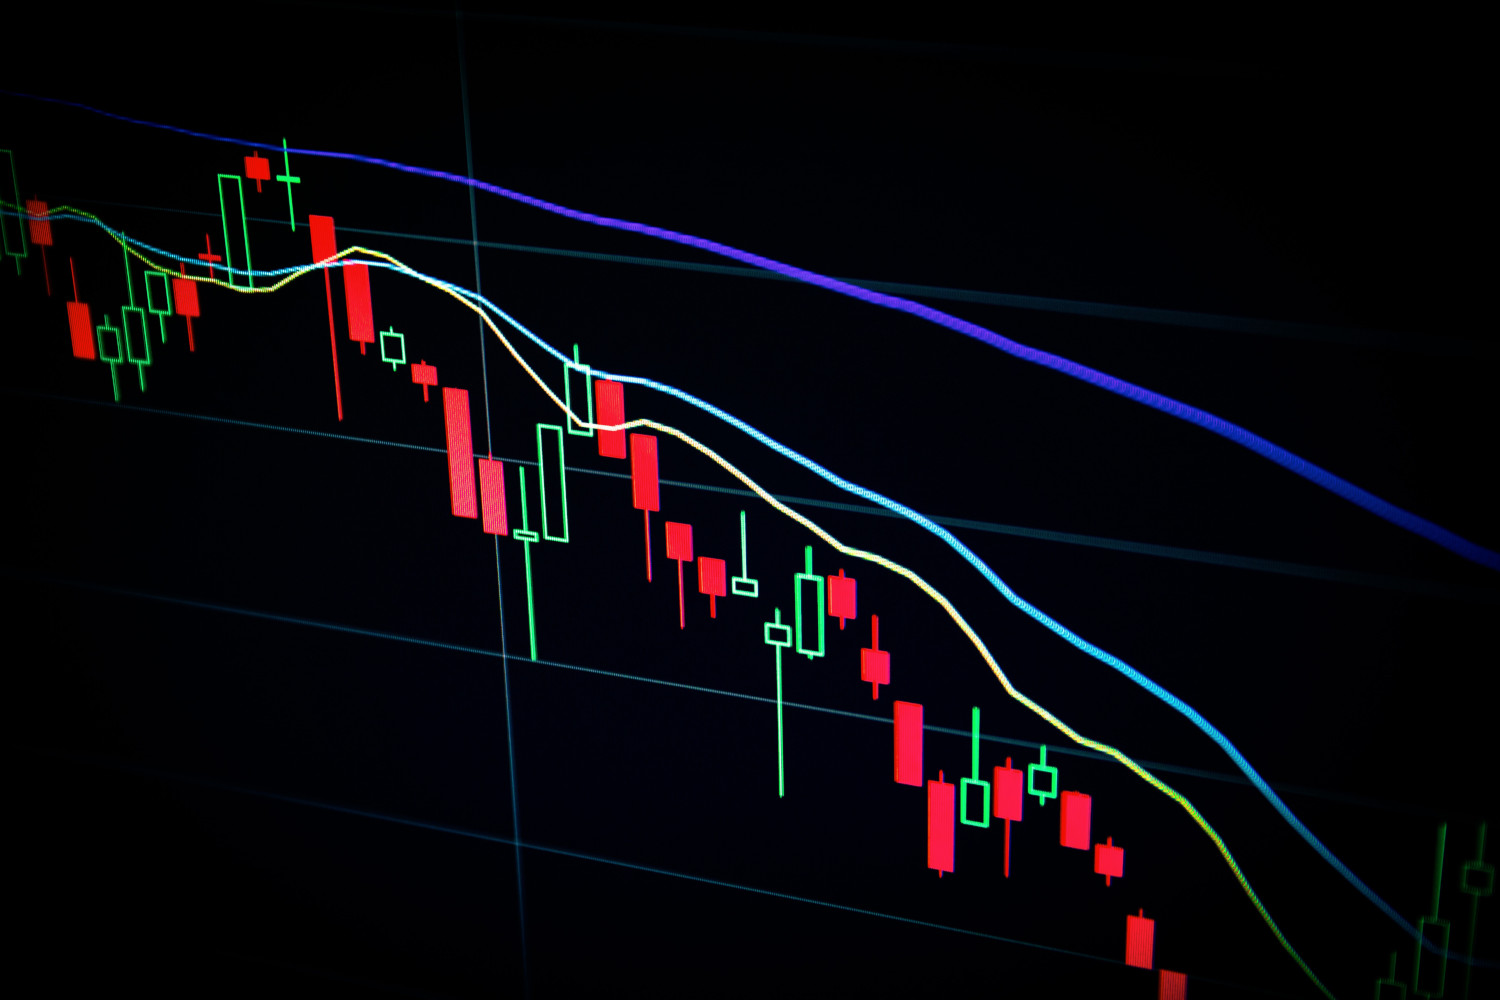
The Moving Average Convergence Divergence (MACD) is a technical analysis indicator designed to gauge momentum by showing the relationship between two moving averages of a security’s price.
It helps traders understand whether bullish or bearish momentum is in play for a particular stock. But, how does it work? There are a few components at play:
- MACD Line: The primary component of MACD is the MACD line itself, calculated by subtracting the 26-period Exponential Moving Average (EMA) from the 12-period EMA.
- Signal Line: The second component is the Signal Line, often a 9-period EMA of the MACD line. This line is plotted alongside the MACD line and acts as a trigger for buy and sell signals.
- Histogram: The MACD Histogram, which is simply the difference between the MACD line and the Signal line, provides a visual representation of the change in momentum. The histogram is positive when the MACD line is above the Signal line (bullish momentum) and negative when below (bearish momentum).
When the shorter EMA (12-period) moves above the longer EMA (26-period), it signals increasing upward momentum, suggesting a potential buying opportunity.
Conversely, when the shorter EMA crosses below the longer EMA, it indicates increasing downward momentum, potentially signaling a selling point.
While the indicator can deliver profound insights, all of this is contingent on using the best MACD settings for swing trading. More on that in a moment., First, why should you consider using MACD for swing trading at all?
Why Consider Using MACD For Swing Trading?
We consider the MACD to be the best moving average for swing trading – but why? What separates it from the other stock market indicators you have at your disposal? We’ll cover the pros and cons of swing trading with MACD below.
Benefits of MACD
There’s no denying the fact that MACD delivers profound insights to inform your trading decisions. It helps you find opportunities and execute them with confidence:
- Trend Identification: MACD is excellent for identifying the overall trend of a security. Its calculation, based on moving averages, smoothes out price data to offer a clearer view of the trend direction. This is crucial for swing traders who aim to capitalize on trends over a medium-term horizon.
- Momentum Insight: One of MACD’s core strengths is its ability to signal the strength of a stock’s momentum. By observing the MACD line’s divergence from the signal line, traders can gauge whether bullish or bearish momentum is increasing or decreasing, helping to time entries and exits more effectively.
- Signal Clarity: The crossover of the MACD line and the signal line provides distinct buy and sell signals. For swing traders, who need to make swift yet calculated decisions, these clear signals are invaluable.
- Flexibility Across Markets: MACD can adapt to various market environments, making it a versatile tool for swing traders who navigate different sectors and market conditions.
- Confirmation Tool: When used in conjunction with other technical indicators or chart patterns, MACD acts as a powerful confirmation tool, increasing the reliability of the trade setups identified.
Limitations to Consider
As with any sort of trading indicator, there are limitations to consider:
- Lagging Nature: As a tool based on moving averages, MACD is inherently a lagging indicator. This means it might signal trend changes after they have already begun, which can be a drawback in fast-moving market conditions.
- False Signals: Particularly in volatile markets, MACD can produce false signals. For example, a temporary price spike can cause the MACD to cross above the signal line, suggesting a bullish trend that may not materialize.
- Over-reliance Risk: Relying solely on MACD can be risky, as it may not account for all market dynamics. It’s essential to use it in conjunction with other analysis methods to gain a more comprehensive market view.
- Requires Experience: Interpreting MACD effectively often requires experience and a good understanding of market contexts. New traders may find it challenging initially to discern between genuine and false signals.
While some of these can be mitigated by using the best MACD settings for swing trading, the truth is that no indicator is “perfect”. That’s why you should use other indicators alongside MACD as well as learn how to combine fundamental and technical analysis.
So, What are the Best MACD Settings for Swing Trading?
You know that MACD is a pivotal part of your swing trading strategy. But do you really need to adjust your settings or can you just use the default settings?
We’ll talk about the importance of fine-tuning your settings below before offering our recommendations on the best MACD settings for swing trading.
The Importance of Your MACD Settings for Swing Trading
Whether you’re trying to learn how to make money trading options or you want to maximize your realistic swing trading returns, the best MACD settings for swing trading are paramount.
MACD settings significantly influence its sensitivity to market movements. The right settings can help swing traders capture significant trends while avoiding minor fluctuations that may lead to false signals.
The challenge lies in finding a balance between responsiveness and accuracy. Overly sensitive settings may provide early signals but with a higher risk of false positives. Conversely, less sensitive settings offer more reliable signals at the cost of speed.
Standard Settings
The standard MACD settings (12, 26, 9) are time-tested and widely used, offering a good balance for various market conditions. They tend to be reliable for capturing broader market trends.
But, these settings may not be optimal for all swing trading scenarios, especially in markets with higher volatility or unique characteristics. The standard settings can sometimes lag in fast-paced environments.
Custom Settings for Different Market Conditions
Below, we’ll highlight a few of the best MACD settings for swing trading in various market conditions:
- For Stable Markets: Consider using the standard settings or slightly slower settings, like 13, 30, 10. Slower settings reduce the risk of reacting to minor price movements, focusing on more significant trends suitable for stable markets. Stable markets often have less noise, so the standard or slightly slower settings can provide clear and reliable signals.
- For Volatile Markets: A faster MACD setting, such as 8, 17, 9, might be more effective. The shorter EMAs will respond quicker to price changes, which is vital in volatile markets. In volatile markets, early detection of trend changes is crucial. Faster settings help in capturing these movements more promptly.
- For Highly Active Swing Traders: Active traders who can manage more frequent trading may opt for even faster settings like 5, 13, 8. These settings are more sensitive and can provide more trading opportunities, but they require constant monitoring and swift decision-making.
All of this is to say that the optimal MACD settings for swing trading depend on the market environment and individual trading style.
While standard settings offer a reliable starting point, customized settings tailored to specific market conditions can enhance trading efficiency. However, it’s essential to understand the implications of different settings and adjust them according to market feedback.
Learn more about the ideal swing trading time frames in our blog. Below, we’ll discuss how to use MACD for swing trading in general before wrapping this conversation up.
How to Use MACD for Swing Trading: Tips and Tricks for Making the Most of This Indicator
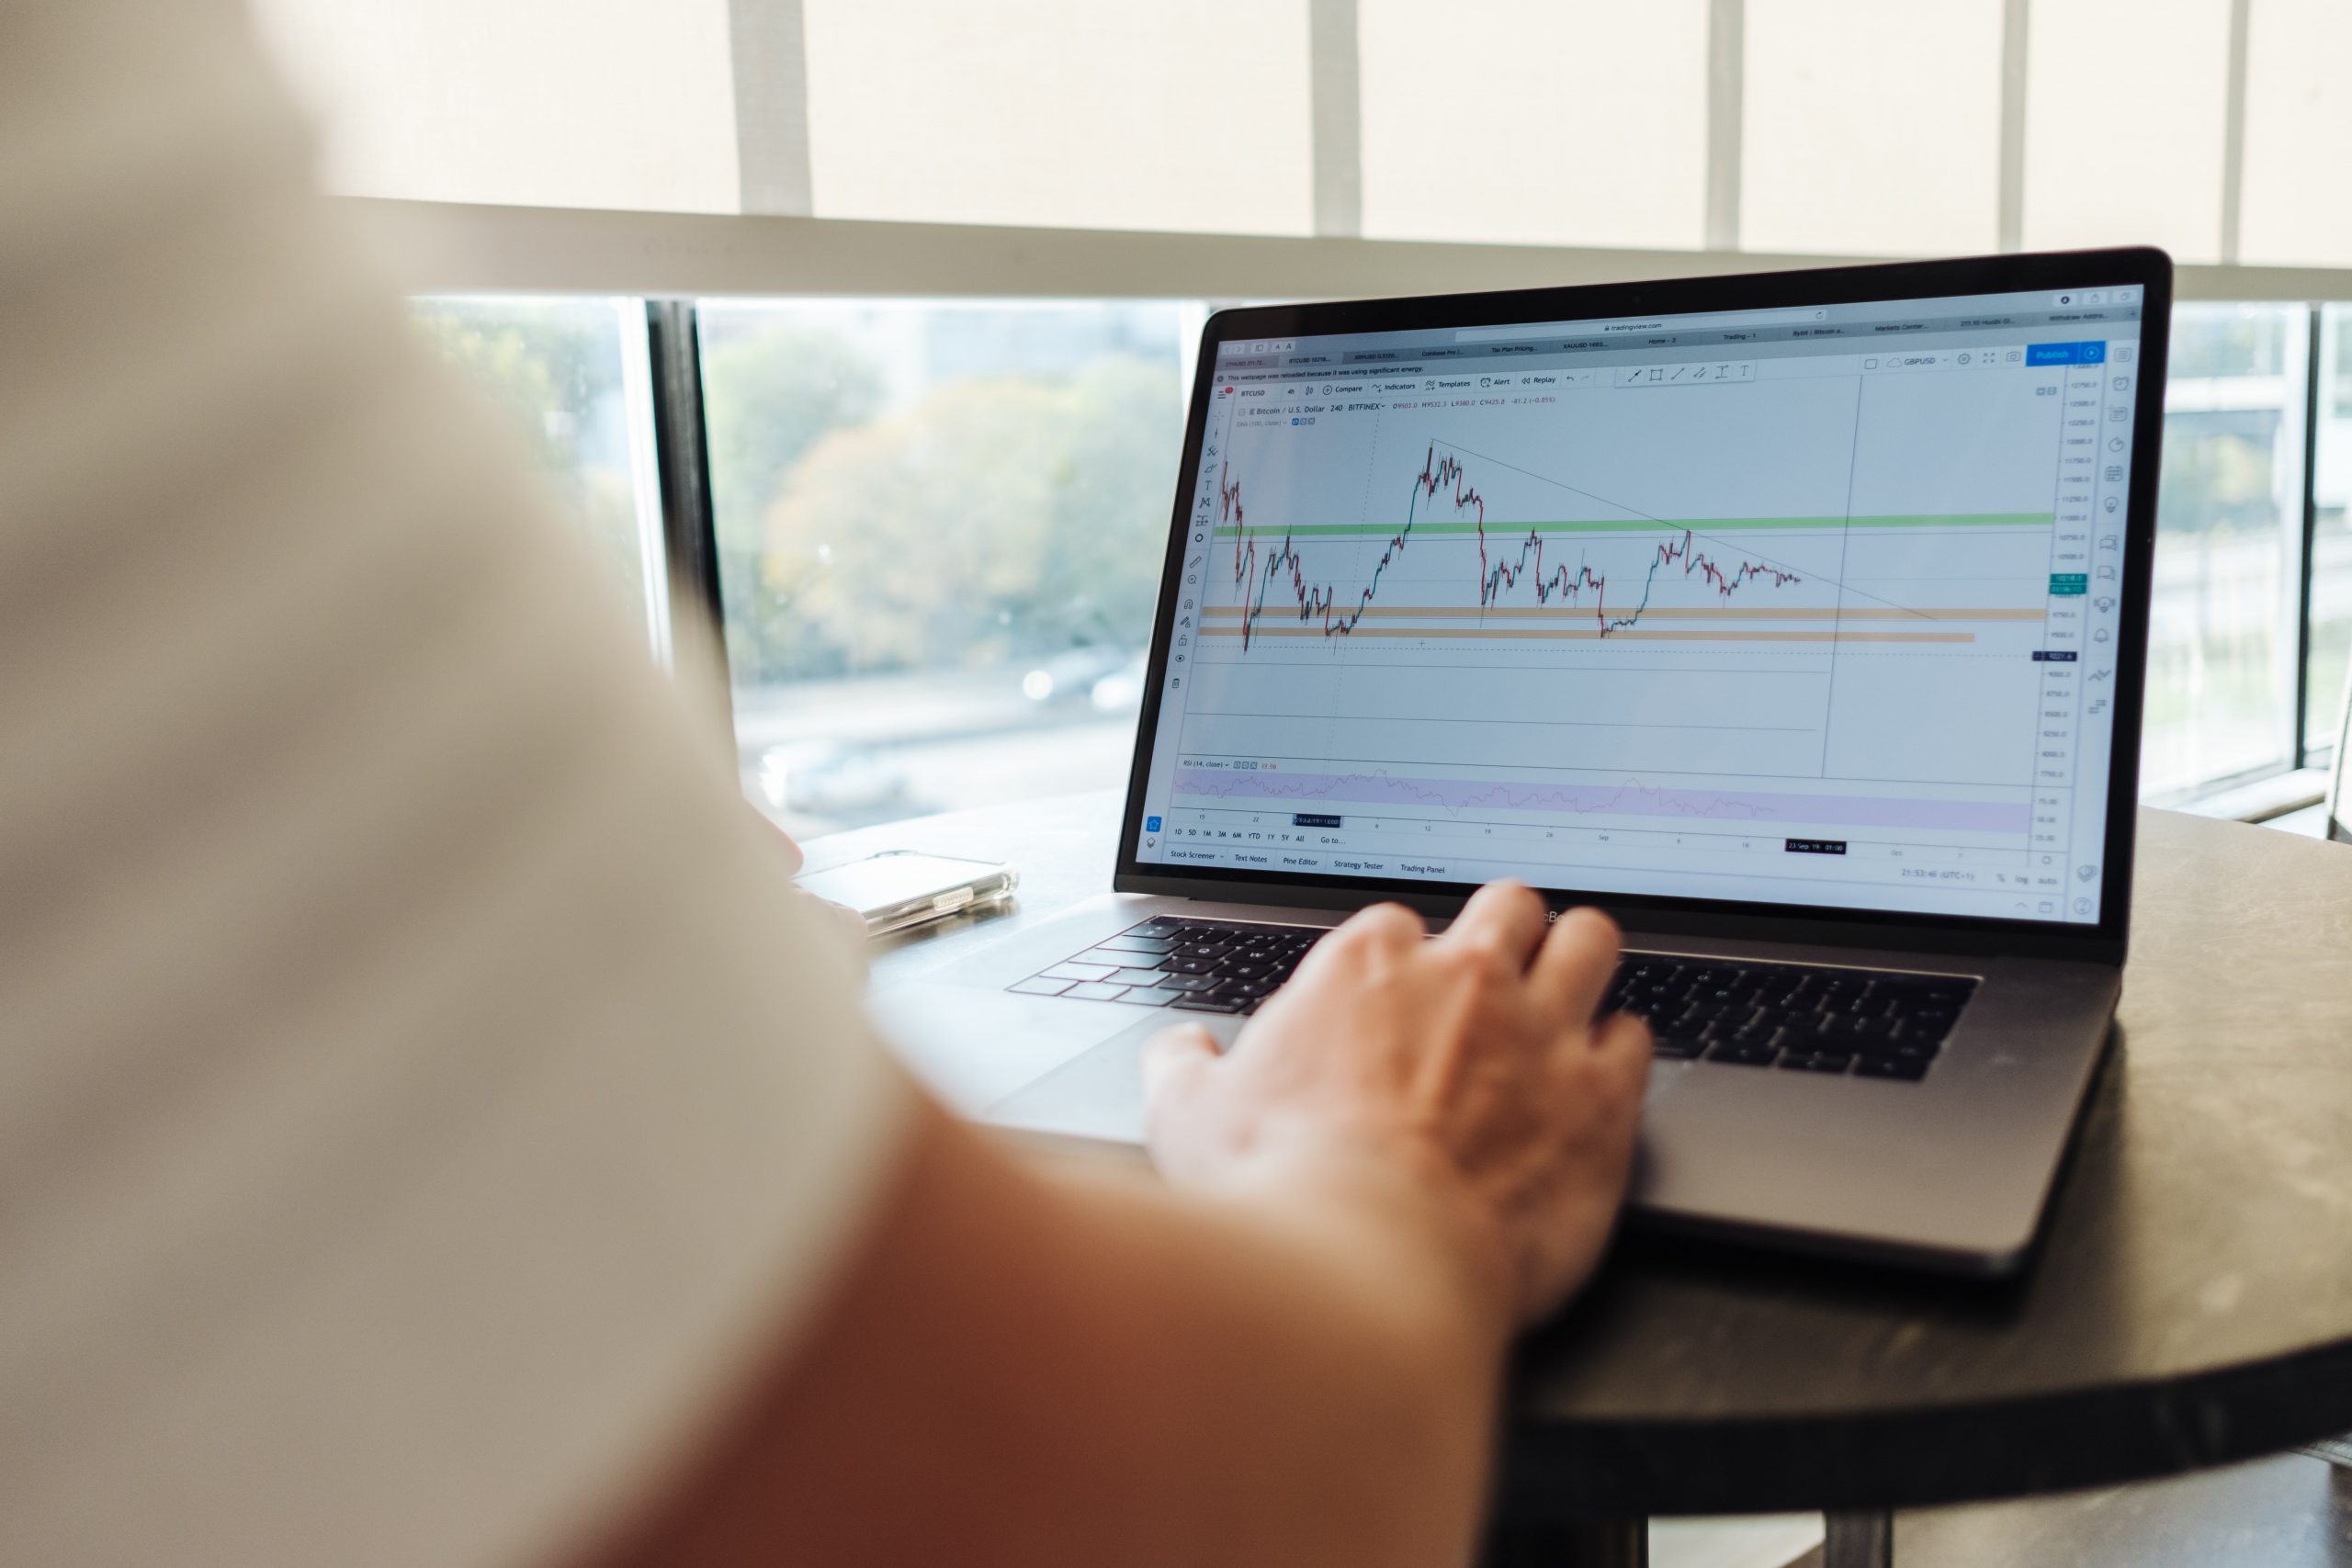
So you know which MACD swing trading settings are best. Now it’s just a matter of learning how to use MACD for swing trading in general. We’ll talk about how to read its signals accurately, combine it with other indicators, and recognize false signals in volatile markets.
Understanding MACD Crossovers
The primary way to interpret MACD is through its crossovers. A bullish signal is indicated when the MACD line (the difference between the 12-day and 26-day EMAs) crosses above the signal line (9-day EMA of MACD).
Conversely, a bearish signal is suggested when the MACD line crosses below the signal line. For swing traders, these crossovers can indicate potential entry and exit points.
Analyzing the Histogram
The MACD histogram, which plots the difference between the MACD line and the signal line, provides additional insight.
A widening histogram suggests increasing momentum (bullish or bearish), while a narrowing histogram can indicate weakening momentum.
When the histogram flips from negative to positive (or vice versa), it often signals a change in trend.
Zero-Crossing
Another important signal is the zero-crossing, where the MACD line crosses the zero line. A move above zero can signal a bullish trend, while a move below can indicate a bearish trend. This can be particularly useful for confirming the strength of a trend after a crossover signal.
Combining MACD with Other Indicators and Techniques
Pairing MACD with moving averages (like the 50-day or 200-day SMA) can offer a more robust analysis. For instance, you might look for MACD crossover signals that align with the price crossing a major moving average.
You can also use the relative strength index (RSI) as a complementary indicator. For example, a MACD bullish signal coupled with an RSI reading above 50 (but not overbought) can reinforce a buy decision.
Volume should increase in the direction of the trend suggested by MACD signals. An upward price move with increasing volume can confirm a bullish trend, while a downward move on high volume might confirm a bearish trend. Learn more about market sentiment indicators in our blog as these will play a role in your decision making as well.
Recognizing False Signals During High Volatility
MACD signals can be prone to false alarms in volatile markets. Using volatility indicators like Bollinger Bands or the Average True Range (ATR) can help filter out misleading signals.
Instead of acting immediately on a MACD crossover, wait for additional confirmation. This might mean waiting for another candlestick pattern to close or for other technical indicators to align.
Always employ risk management techniques such as setting stop-loss orders to protect against sudden market moves. This is especially crucial in volatile conditions where the market can move rapidly against your position.
VectorVest can help you set your stop losses and empower you to cut losses when necessary. Speaking of which, let’s talk about how you can win more trades with less work by using our stock advisory below!
Incorporating VectorVest into Your Swing Trading Strategy for Simpler, Stress-Free Analysis
Even if you know how to use MACD for swing trading, it’s important to round out your strategy with other forms of fundamental analysis or technical analysis. You can learn more about how to analyze stocks in our blog – or, you can simplify your strategy with the best platform for swing trading!
As we said earlier, VectorVest empowers you to win more trades with less work and stress. How does it enhance your swing trading stock selection and execution, though? You’re given clear, actionable insights in 3 simple ratings:
- Relative Value (RV): The RV rating is a comparison of a stock’s long-term price appreciation potential (forecasted 3 years out), AAA corporate bond rates, and risk. It offers much better insight than a simple comparison of price to value alone.
- Relative Safety (RS): The RS rating is an indicator of risk. It’s derived through an analysis of the company’s financial consistency & predictability, debt-to-equity ratio, business longevity, price volatility, sales volume, and other factors.
- Relative Timing (RT): This rating is based on the direction, dynamics, and magnitude of the stock’s price movement day over day, week over week, quarter over quarter, and year over year.
Each rating sits on its own scale of 0.00-2.00 with 1.00 being the average, allowing for quick and easy interpretation. This ease of use is what makes it such a powerful swing trading tool.
But it gets even easier for those wondering how to find options to trade or trying to find the best stocks to day trade. You’re given a clear buy, sell, or hold recommendation for any given stock at any given time based on these ratings.
You also can use our screeners to find opportunities on autopilot, so you never have worry about how to pick a stock again.
While you can still rely on the best MACD settings for swing trading, the truth is that investing doesn’t have to be time-consuming or complicated. Why work harder when you can work smarter with VectorVest?
Get a free stock analysis today and find out firsthand what you’ve been missing out on all this time!
Parting Thoughts on the Best MACD Settings for Swing Trading
In our exploration of the best MACD swing trading settings, we’ve uncovered that the right settings and interpretation are pivotal. Accurate reading of MACD signals, coupled with other indicators, can significantly enhance trading strategies, especially in volatile markets.
Remember, the best MACD settings are those that align with your trading style and market conditions. To further empower your trading decisions, VectorVest offers advanced analytics and real-time insights, simplifying complex market data.
You can learn more about swing trading for beginners in our blog. We have articles like swing trading patterns, paper trading, market timing strategies, best time of the day to buy stocks, what affects stock price, positional trading vs swing trading, timing the market vs time in the market, how to buy the dip, and more.
Whether you’re looking for the best beginner stocks to buy or the safest stocks for retirement, VectorVest can help you find them without any of the guesswork or stress of relying on traditional indicators.
So, if you’re serious about swing trading for a living or just want some supplemental income, invest in the best stock analysis app today and transform your trading strategy for the better!

Leave A Comment