Whether you’re a day trader or swing trader, position trader, value investor, or anything in between, gone are the days of relying on outdated forms of stock analysis.
Now, you’re able to rely on tools to help you streamline your investment decisions and make more clear, calculated trades with less work and less stress.
But, what is the best fundamental analysis tool? You need something that can help you cut through the noise and uncertainty, meticulously dissecting financial data to present clear investment insights.
And we have just the thing for you.
Our stock forecasting software works tirelessly to sift through data, identify trends, and highlight lucrative opportunities. This is an investment that pays for itself, transforming complex data into actionable intelligence, ensuring that you’re always a step ahead.
With a robust array of features tailored for both novice and seasoned traders, VectorVest stands as a beacon of precision, guiding you towards informed and profitable trading decisions.
Embrace the future of trading with confidence, as we delve into how VectorVest can redefine your investment strategy and usher in a new era of trading success.
What is a Fundamental Analysis Tool?
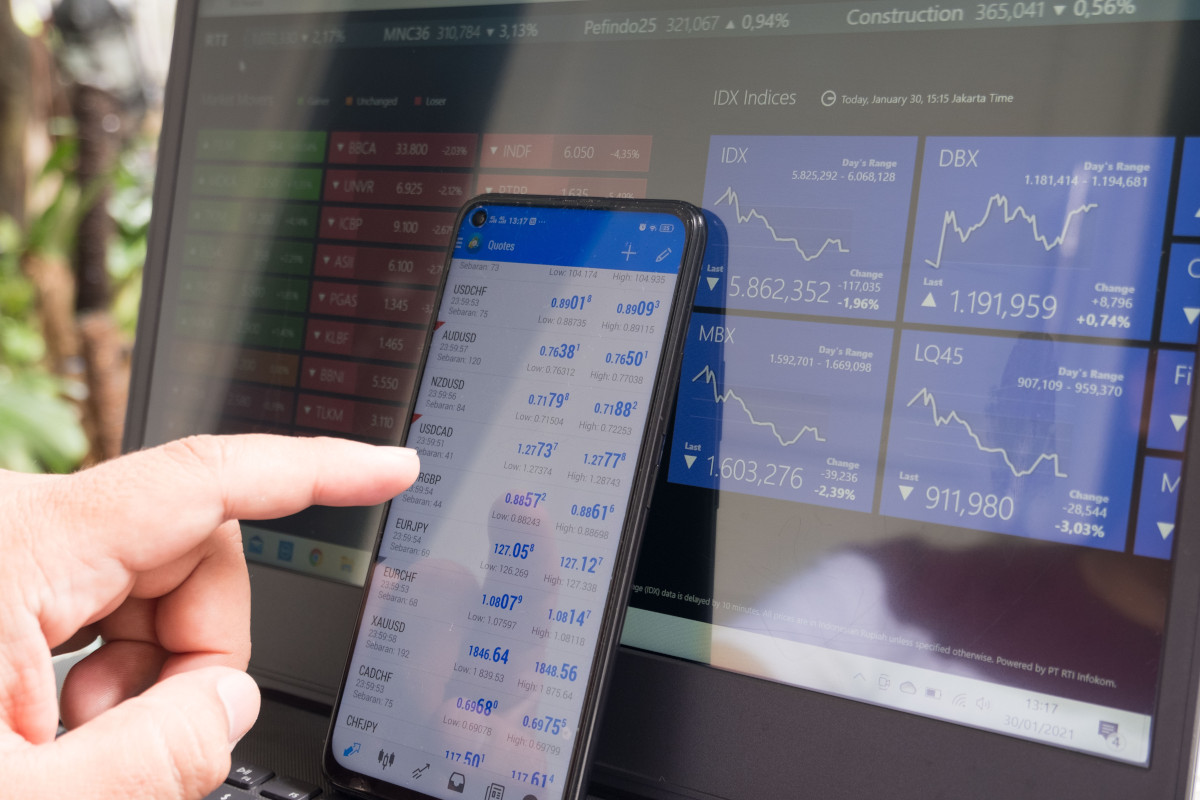
First things first – what are we talking about when we discuss tools for fundamental analysis? These are typically software-based offerings that help investors evaluate a company’s financial health, understand its growth prospects, and make informed investment decisions.
More specifically, they turn complex information into actionable insights by aggregating and analyzing vast amounts of financial data. A tool might scrutinize aspects like earnings, revenues, assets, and liabilities.
The ultimate purpose is to derive a true value of the company’s stock and ascertain whether it is overvalued or undervalued in the current market. It provides access to comprehensive financial statements, performance metrics, and industry comparisons.
It may even allow users to conduct ratio analysis, helping them to understand profitability, liquidity, and solvency. Additionally, it incorporates forecasting and valuation models, offering predictions based on historical data and current trends.
One such example of this feature, which we’ll describe in greater detail later on, is VectorVest’s relative value (RV), rating. It looks at a company’s 3-year price appreciation potential, offering far superior insights than a simple comparison of price to value alone.
Investors who harness the power of these tools equip themselves with a robust framework for making data-driven decisions, mitigating risks, and identifying potential opportunities in the stock market. That being said, let’s further elaborate on the value fundamental analysis tools have to offer.
How Investing in a Stock Fundamental Analysis Tool Can Elevate Your Investment Strategy
Just as we talked about in our guides to investing in swing trading tools or the best platform for swing trading, you are transforming your approach to investing for the better by leveraging a fundamental analysis tool.
In essence, you’re paying for peace of mind and higher returns. Need we say any more? If you’re still not quite sure, here’s what you stand to gain by investing in a tool for fundamental analysis…
Enhancing Accuracy and Reliability
First and foremost, these tools provide accurate and reliable data that is crucial for assessing a company’s intrinsic value. They ensure that the financial statements, market data, and performance metrics you rely on are up-to-date and trustworthy.
This precision in data helps eliminate the guesswork and subjective judgments, laying down a solid foundation for your investment choices. You can rest assured you’re working with solid information, and that helps you feel confident in making trades.
Streamlining the Decision-Making Process
Time is of the essence in stock trading, and a fundamental analysis tool streamlines your decision-making process.
Instead of sifting through piles of reports and data sheets, you get instant access to synthesized information and analytics, enabling you to make swift and informed decisions.
This efficiency not only saves time but also ensures you don’t miss out on potential opportunities in the fast-paced trading environment. Considering time is among the only commodities you can’t buy back, why would you not invest in a tool that saves you more of it?
Managing Risks and Identifying Opportunities
Furthermore, these tools play a crucial role in risk management and opportunity identification. They help in identifying the potential red flags and investment risks by providing a comprehensive analysis of a company’s financial health, growth potential, and market position.
Concurrently, they highlight the undervalued stocks and growth opportunities, guiding you toward making investments that align with your financial goals and risk tolerance. So, not only do they help you assess when to buy stocks and when to sell stocks – they tell you how to pick a stock!
Now, let’s be clear – knowing how to do fundamental analysis of stocks (more importantly, how to combine fundamental and technical analysis together) is important as well.
That’s why we have guides on how to analyze a stock before buying along with tips on when to use fundamental analysis vs technical analysis, how to do technical analysis of stocks, what drives stock prices, and more.
However, you don’t need to work harder than necessary. With a solid grasp on the principles themselves, you can allow technology to do the heavy lifting for you. So, what is the best tool for stock fundamental analysis?
So, What is the Best Tool for Stock Fundamental Analysis?
It’s crucial to focus on specific criteria to ensure that the software meets your investment needs and enhances your trading strategy when selecting a stock fundamental analysis tool. So, let’s start there before officially introducing you to the best fundamental stock analysis tool on the market.
Criteria for Evaluation: What You Should Look For in a Tool
Ensure the tool offers extensive coverage of financial data, sourcing information from reliable and up-to-date databases.
It should provide a wide array of metrics and indicators, including earnings per share, debt-to-equity ratio, and return on equity, to give you a holistic view of a company’s performance.
A user-friendly interface is also key to efficient analysis. The tool should present data in an organized manner, with intuitive navigation and easy-to-understand visuals, facilitating a smoother learning curve and quicker adoption, even for those new to investing. After all, the goal is to speed up time through technology!
Look for features that allow you to set personalized alerts, create watchlists, and filter stocks based on your criteria. Additionally, ensure the tool is scalable, capable of growing with your expanding portfolio and evolving investment goals.
Effective analytical and reporting capabilities are a must. The tool should not only provide raw data but also offer insights and interpretations, helping you make sense of the numbers.
Look for features that generate comprehensive reports, summarizing key financial metrics and trends, aiding in your decision-making process.
But, one of the most important things to look for in a stock fundamental analysis tool is historical data. Does the tool show you past performance so you can see just how accurate its recommendations are? If not, there’s a reason for that.
There’s currently only one tool that saves you time and stress while empowering you to win more trades – and has a reputation to back it all up. Allow us to officially introduce you to the best tool for stock fundamental analysis: VectorVest.
What Makes VectorVest the Best Tool for Stock Fundamental Analysis?
VectorVest has outperformed the S&P 500 index by 10x over the past 20 years and counting. Our software has managed to predict trends in the stock market, calling every major market move since the dot com bubble to the recent COVID-19 correction.
From earnings and sales growth to debt levels and dividend stability, VectorVest evaluates a broad spectrum of fundamental factors. This comprehensive approach empowers investors to understand a company’s true financial health, steering clear of superficial analysis.
Let’s get more specific, though. The Relative Value rating that we touched on earlier is a comparison between a stock’s long-term price appreciation (forecasted 3 years out) compared to AAA corporate bond rates.
But, there’s also the Relative Safety (RS) rating. This is an indicator of risk that’s computed from an analysis of a company’s financial consistency & predictability, debt-to-equity ratio, business longevity, price volatility, and other factors.
Interpreting these ratings is simple and straightforward as each sits on a scale of 0.00-2.00 with 1.00 being the average. Ratings above the average indicate overperformance in a given category and vice versa.
We also have a market sentiment indicator that helps you gauge market conditions on any given day – clueing you into when conditions are favorable and when you may be at risk of investing in a down market.
VectorVest makes it easier than ever to vet a company’s value and risk level. But, that’s just the tip of the iceberg…
It Can Help You With Technical Analysis, Too!
There’s one rating we haven’t told you about yet – Relative Timing (RT). This rating is based on the direction, dynamics, and magnitude of a stock’s price movement. It’s calculated day over day, week, over week, quarter over quarter, and year over year.
The RT rating helps you time your trades to perfection and buy the dip just at the right time. A rating appreciating above 1.00 shows that the stock has a strong positive price trend. Conversely, a falling RT rating suggests a weakening price trend – and is your signal to get out with your profits or cut losses on stock.
There’s no question that VectorVest is the best app for stock analysis. It tells you what to buy, when to buy it, and when to sell it. That being said, let’s talk a bit more about how to actually use it below.
How to Use the Tool Yourself
VectorVest makes it easy to uncover your next trade on a daily basis. Pull up our list of pre-curated stock screeners and find a category that resonates with your investment style and goals.
From the best stocks to swing trade to the best stocks to invest in as a beginner, the biggest movers on any given day to the safest stocks for retirement, you can take a look around and see what catches your eye. From there, it’s just a matter of diving deeper into the analysis with VectorVest’s VST system.
We advocate for buying safe, undervalued stocks that are rising in price. But, it gets even easier. You’re given a clear buy, sell, or hold recommendation based on the overall VST rating for any given stock, at any given time.
No more guesswork. No more uncertainty. No more wasted time on complex fundamental or technical analysis. Just simple, straightforward investing and higher returns.
Get a taste of what VectorVest has to offer in our stock advisory app by getting a stock analysis free today. Then, after seeing what’s possible with our fundamental analysis tool, start your subscription with a 30-day trial!
Wrapping Up Our Guide to the Best Stock Fundamental Analysis Tool
Embracing VectorVest as your go-to stock fundamental analysis tool is a strategic move toward enhancing precision, reliability, and efficiency in your investment endeavors.
Our software is an unparalleled ally for both novice and experienced investors through its comprehensive data analysis, clear recommendations, and the unique addition of technical analysis features.
You can learn technical analysis of stocks, the best indicator for swing trading, ideal swing trading time frames, how to read stock trends, how to time the market, what happens to the stock market during a recession, where to put retirement money after retirement, timing the market vs time in the market, and other swing trader tips in our blog to help you feel more confident in your abilities.
Unlock the full potential of your investment strategy, reduce stress, save time, and increase your chances of trading success with our stock fundamental analysis tool today!


Leave A Comment