
Every investor, from beginner swing traders to seasoned professionals, yearns for the ability to foresee the market’s next move. After all, if you know which way a stock’s price is heading, executing your trades accordingly becomes a whole lot easier and less stressful!
But is it easy to predict trends in the stock market? Is it even possible to learn how to predict stock market trends? It can be when you empower yourself with the right education and tools for success.
We’ll guide you through the concept of predicting stock market trends to help you set your expectations and gain an understanding of how trend trading works.
Then, we’ll introduce you to a system you can leverage that has called every major market move for more than 20 years now since the Dot Com Bubble.
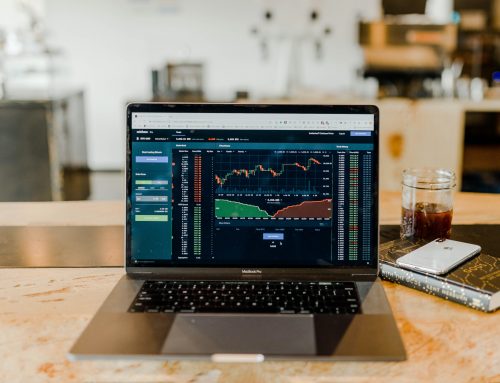
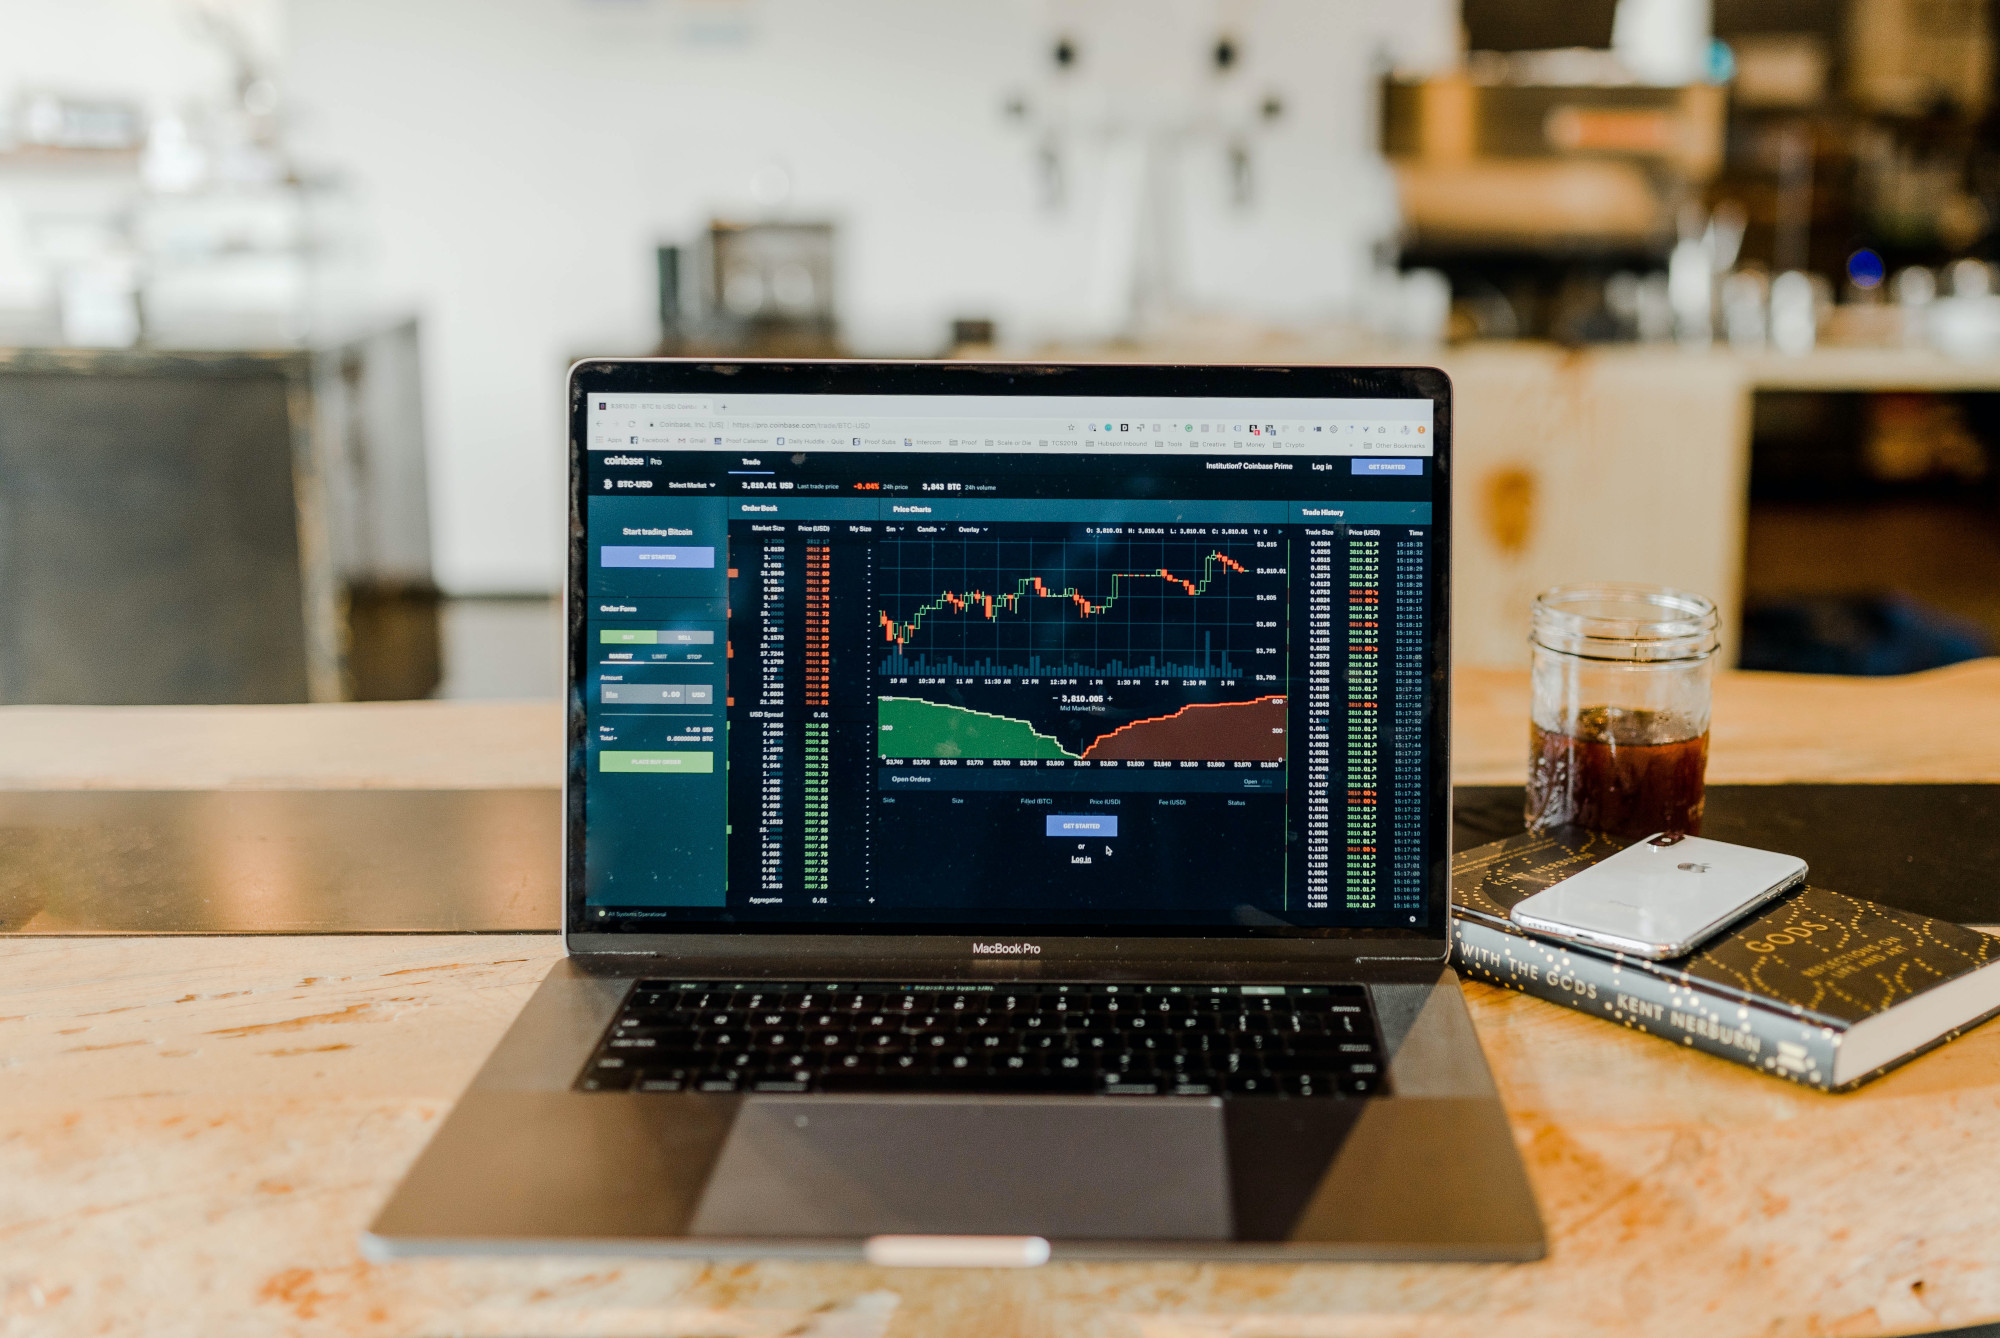
With the VectorVest stock analysis software, you can stay ahead of trends and win more trades with less work and less stress. But before we show you what a difference the best app for stock analysis can make, let’s set the stage a bit by discussing what stock trends are.
What are Trends in the Stock Market?
Understanding stock market trends is essential for anyone diving into the investing world. But what exactly do we mean when we talk about these trends?
The Basic Concept of Market Trends
A market trend refers to the general direction in which the price of an asset or market is moving. It’s a reflection of the prevailing sentiment among the majority of investors at any given time.
Trends give us a macro view of the market’s pulse, indicating whether the overall sentiment is bullish (positive), bearish (negative), or neutral.
Differentiating Between Uptrends, Downtrends, and Sideways Trends
There are three types of trends in the most general sense of the definition:
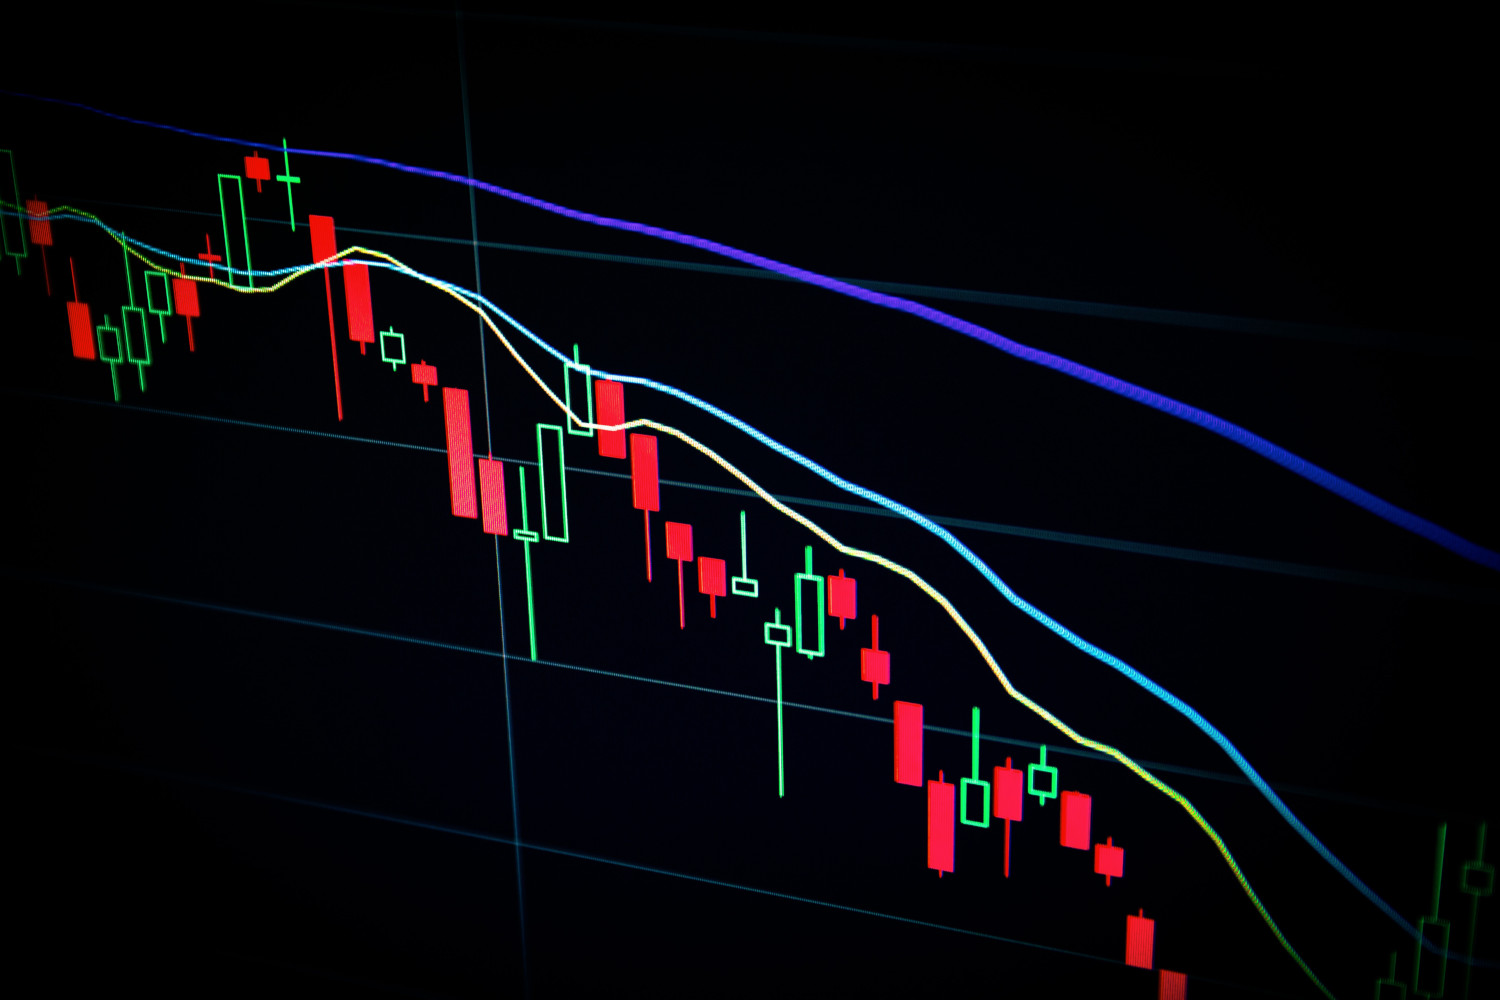
- Uptrends: An uptrend signals bullish sentiment and is characterized by higher highs and higher lows in stock prices. Positive news, robust company performance, or a favorable economic environment often fuels optimism and sends shares higher. An uptrend appears as a series of ascending peaks and troughs on a chart.
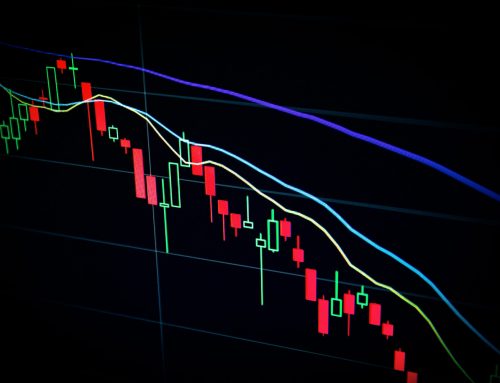
- Downtrends: As the name suggests these are the opposite of uptrends. They represent periods where pessimism reigns. Stock prices exhibit lower highs and lower lows. Factors such as unfavorable company news, economic downturns, or global events can lead to a bearish market. A downtrend will showcase descending peaks and troughs on a chart.
- Sideways Trends: The market doesn’t always distinctly move up or down. It can move horizontally to signal a period of consolidation where neither the bulls nor the bears have a clear upper hand. It’s a phase where the market is deciding its next direction, often due to a lack of significant news or events to push it either way. You’ll notice the stock price moving within a horizontal range on a chart without any clear upward or downward trajectory.
Is it Easy to Predict Trends in the Stock Market?
The big question at hand is how difficult it is to predict trends on a consistent basis. So, is it easy to predict trends in the stock market?
It’s worth comparing trend prediction to market timing strategies here. Many investors claim that market timing doesn’t work. But with the right tools and mindset, you can absolutely learn how to time the market and buy the dip on a consistent basis.
The same is true of trend prediction. While it’s not easy by any means, it’s entirely possible when you invest in yourself and use a suite of tools that’s proven to work. Let’s look at some of the factors influencing the ability to predict trends in the stock market below.
The Unpredictability of the Market: Factors at Play
If you read our guide on how the stock market works, you know it isn’t just influenced by numbers. It’s a vast ecosystem driven by a blend of tangible data and human emotions. Consider factors like:
- Economic Reports: Data such as employment numbers, inflation rates, recession concerns, and consumer sentiment indices can sway the market’s mood.
- Global Events: Political tensions, trade deals, or even unexpected natural disasters can instantly shift the market dynamics.
- Company News: Earnings reports, management changes, and even product launches play a crucial role in a specific stock’s movement.
- Investor Sentiment: Perhaps the most unpredictable factor of all. Fear, greed, speculation, and overreaction can lead to significant market volatility. All of these emotional factors are referred to as market sentiment.
Add to this the rapidly changing technological landscape, which introduces algorithmic trading and high-frequency trades, and the predictability of the market becomes even more intricate.
So, Is it Easy to Predict Trends in the Stock Market?
That being said, is it easy to predict trends in the stock market? Not necessarily. In fact, it can be quite challenging without the right approach.
While seasoned traders and investors, equipped with years of experience, can make educated guesses and often time the market well, it remains just that – an educated guess. Human emotions like fear and greed often cloud judgment, leading to decisions that might not always align with logic or data.
However, that’s not to say predicting trends is a game of mere chance. With diligent research, a well-crafted strategy, and, most importantly, the right tools, one can considerably increase the odds of making accurate market predictions.
With that being said, let’s talk about how to predict stock market trends with precision below using traditional methods.
How to Predict Stock Market Trends With Precision
Precision is paramount in a landscape where every percentage point counts and each move could mean the difference between profit and loss.
But how does one fine-tune their predictive capabilities? The answer lies in a balanced approach. Here’s how to predict stock market trends with precision using traditional forms of analysis: technical vs fundamental analysis.
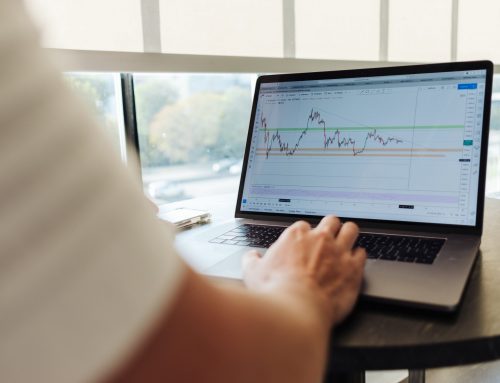
Relying on Data: The Power of Technical Analysis
What is technical analysis of stocks, you ask? It’s the bedrock of trend prediction. Traders can identify trading patterns that indicate potential future movements based on past market data, mainly price and volume.
This analysis often involves chart patterns, moving averages, and various trading indicators like the Relative Strength Index (RSI) or Moving Average Convergence Divergence (MACD).
The idea is simple: history tends to repeat itself. If a particular pattern has led to a specific movement in the past, the same pattern can be a precursor to a similar movement in the future.
That being said, we encourage you to learn more about how to do technical analysis of stocks in our blog. We also have a more comprehensive resource on how to analyze a stock in general which gets into the other side of the coin as well: fundamental analysis.
The Significance of Fundamental Analysis
While technical analysis looks at the ‘what’ and ‘when’ of stock prices, fundamental analysis delves into the ‘why’. It provides insights into a stock’s intrinsic value by evaluating a company’s financial health, industry position, and overall economic factors.
Key performance indicators like earnings per share (EPS), price-to-earnings (P/E) ratios, and company balance sheets offer a more profound understanding of whether a stock is undervalued or overvalued.
When combined with technical analysis, traders get a holistic view of the market situation. Learn more about how to do fundamental analysis of stocks in our blog. But, analysis is only one part of the equation as far as how to pick a stock…
The Role of Intuition, Experience, and Networking in Market Prediction
There’s an intangible element to stock market prediction beyond the charts, numbers, and financial reports: human instinct. Traders develop a sixth sense as they gain experience investing.
This intuition can sometimes pinpoint market movements even before they happen. It’s often shaped by years of success coupled with plenty of failures.
However, with human intuition comes human error and emotion – two of the biggest reasons it’s not easy to predict trends in the stock market. It’s important to leave your ego at the door and do your best to remain unbiased and emotionless in your decision-making.
Furthermore, networking plays a crucial role. Interacting with other traders, attending seminars, or being part of trading forums can provide insights that might not be visible through data alone.
Hearing different perspectives, getting real-time feedback, and sharing strategies can enrich a trader’s knowledge and predictive abilities.
Discover the Easy Way to Predict Trends in the Stock Market With VectorVest!
There you have it – how to predict stock market trends. Unforeseen factors can lead one astray and lead to errors in predicting trends. From human error to emotion to the dynamic nature of the stock market itself, there is so much to keep in mind.
That’s why having a system that helps you tune out the noise is invaluable. VectorVest is a proven system that has outperformed the S&P 500 index by 10x over the past two decades and counting, calling every major market move along the way.
Here’s how it can help you predict trends in the stock market with consistency and confidence…
Introducing VectorVest: Calling Every Major Market Move For More Than 20 Years
VectorVest has been at the forefront of stock market analysis since the Dot Com Bubble. The platform has been steadfast in its accuracy, catching every significant market shift over two decades.
But it’s not just about history – it’s about the advanced algorithms and expert insights that power VectorVest. The tool takes into account both technical and fundamental indicators, ensuring a rounded perspective that’s both deep and wide.
Let’s take a deeper look at how it works to help you pick stocks for day trading, find stocks to swing trade, or find options to trade below.
How the System Helps You Stay Ahead of Trends to Win More Trades Without the Guesswork
Guesswork can be costly in stock trading. You remove that element of uncertainty with VectorVest.
The platform provides real-time trend analysis, keeping you informed about potential market moves before they happen. Even those new to trading can grasp where the market is heading with its intuitive dashboard. You’re given a clear idea of how the market is performing on any given day through the market sentiment indicator.
But, as far as predicting trends in individual stocks, you’ll rely on the tried-and-true VST system. It’s comprised of three simple ratings: relative value (RV), relative safety (RS), and relative timing (RT). These all sit on a simple scale of 0.00-2.00 with 1.00 being the average.
The ratings boil down all the key insights from technical and fundamental analysis into an easier-to-understand and interpret manner. This means you’re still getting the information you need to make calculated decisions – but you’re getting these insights at just a glance.
Better yet, the system gives you a clear buy, sell, or hold recommendation for any given stock at any given time based on these ratings.
And with proprietary screeners in place, your next trading opportunity is just a click away – whether you’re looking for the best stocks for swing trading, the best beginner stocks, or anything else for that matter.
See the system in action by getting a free stock analysis today. And then, set yourself up with our desktop or mobile stock advisory system. It’s time to make trend prediction easier than ever before!
Final Thoughts on How to Predict Stock Market Trends with Precision
So, is it easy to predict trends in the stock market? As you can see, this question all depends on the extent to which you’re willing to invest in yourself with educational resources and tried-and-true tools.
While dedication and research can refine your trading tactics, the most precise approach to how to predict stock market trends melds seasoned wisdom with innovative technology.
VectorVest bridges this gap, turning complex analysis into actionable insights. Why wade through uncertainty when a tried-and-true system awaits?
Learn more about the swing trading basics, best swing trading strategies, when to sell stocks for profit, when to cut your losses on a stock, the best day of the week to buy stocks, and more in our blog.
Otherwise, dive into the best platform for swing trading and elevate your investment strategy today. Let VectorVest be your guiding light to predict market trends with unmatched precision!


Leave A Comment